DigitalRealty DLR full analysis,charts,indicators,moving averages,SMA,DMA,EMA,ADX,MACD,RSIDigital Realty DLR WideScreen charts, DMA,SMA,EMA technical analysis, forecast prediction, by indicators ADX,MACD,RSI,CCI NYSE stock exchange
operates under Consumer Services sector & deals in Real Estate Investment Trusts
Daily price and charts and targets DigitalRealty Strong Daily Stock price targets for DigitalRealty DLR are 170.03 and 174.33 | Daily Target 1 | 169.07 | | Daily Target 2 | 170.99 | | Daily Target 3 | 173.36666666667 | | Daily Target 4 | 175.29 | | Daily Target 5 | 177.67 |
Daily price and volume Digital Realty
| Date |
Closing |
Open |
Range |
Volume |
Mon 20 October 2025 |
172.92 (0.11%) |
175.74 |
171.44 - 175.74 |
1.3162 times |
Fri 17 October 2025 |
172.73 (-0.71%) |
171.78 |
170.47 - 173.52 |
1.0198 times |
Thu 16 October 2025 |
173.96 (-0.71%) |
173.95 |
172.80 - 176.23 |
1.0175 times |
Wed 15 October 2025 |
175.20 (1.93%) |
173.29 |
173.11 - 176.86 |
1.1175 times |
Tue 14 October 2025 |
171.88 (0.19%) |
170.10 |
169.45 - 172.32 |
0.8787 times |
Mon 13 October 2025 |
171.56 (1.82%) |
168.87 |
168.54 - 171.57 |
0.7391 times |
Fri 10 October 2025 |
168.49 (-3.84%) |
175.22 |
168.45 - 175.73 |
1.1976 times |
Thu 09 October 2025 |
175.21 (0.58%) |
174.41 |
173.30 - 175.96 |
0.919 times |
Wed 08 October 2025 |
174.20 (-0.54%) |
174.77 |
173.05 - 176.95 |
1.1358 times |
Tue 07 October 2025 |
175.14 (-1.03%) |
176.88 |
174.14 - 177.04 |
0.6589 times |
Mon 06 October 2025 |
176.96 (0.35%) |
176.56 |
174.51 - 178.29 |
1.0287 times |
Weekly price and charts DigitalRealty Strong weekly Stock price targets for DigitalRealty DLR are 170.03 and 174.33 | Weekly Target 1 | 169.07 | | Weekly Target 2 | 170.99 | | Weekly Target 3 | 173.36666666667 | | Weekly Target 4 | 175.29 | | Weekly Target 5 | 177.67 |
Weekly price and volumes for Digital Realty
| Date |
Closing |
Open |
Range |
Volume |
Mon 20 October 2025 |
172.92 (0.11%) |
175.74 |
171.44 - 175.74 |
0.273 times |
Fri 17 October 2025 |
172.73 (2.52%) |
168.87 |
168.54 - 176.86 |
0.99 times |
Fri 10 October 2025 |
168.49 (-4.46%) |
176.56 |
168.45 - 178.29 |
1.0247 times |
Fri 03 October 2025 |
176.35 (2.85%) |
172.69 |
169.26 - 178.30 |
1.1271 times |
Fri 26 September 2025 |
171.46 (-0.36%) |
171.17 |
169.67 - 176.15 |
0.9962 times |
Fri 19 September 2025 |
172.08 (-0.82%) |
172.34 |
170.69 - 175.83 |
1.5495 times |
Fri 12 September 2025 |
173.50 (6.29%) |
162.00 |
159.22 - 175.59 |
1.5531 times |
Fri 05 September 2025 |
163.24 (-2.62%) |
165.09 |
159.22 - 165.92 |
0.9275 times |
Fri 29 August 2025 |
167.64 (0%) |
168.47 |
166.31 - 169.91 |
0.2607 times |
Fri 29 August 2025 |
167.64 (0.35%) |
166.67 |
165.36 - 170.50 |
1.2982 times |
Fri 22 August 2025 |
167.06 (0.1%) |
167.14 |
162.52 - 168.15 |
1.1881 times |
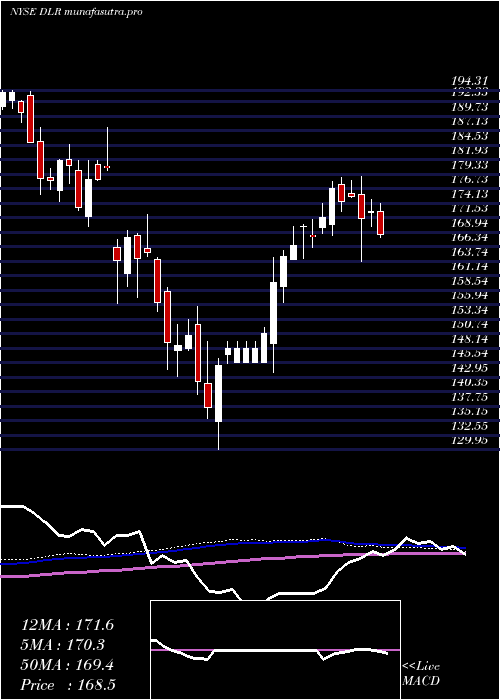
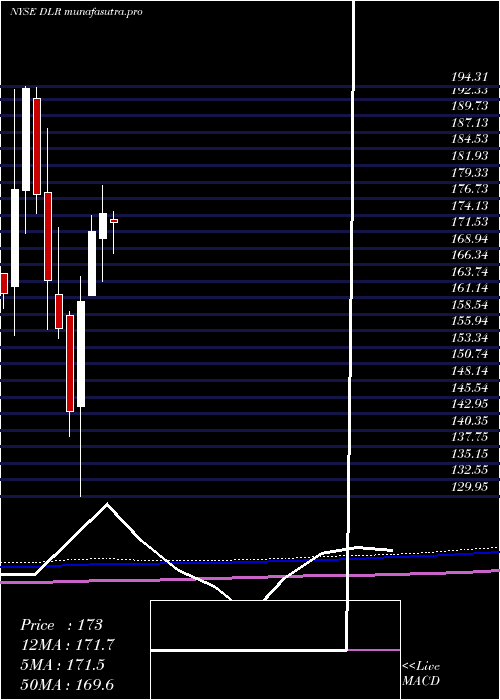
Monthly price and charts DigitalRealty Strong monthly Stock price targets for DigitalRealty DLR are 170.69 and 180.54 | Monthly Target 1 | 163.37 | | Monthly Target 2 | 168.15 | | Monthly Target 3 | 173.22333333333 | | Monthly Target 4 | 178 | | Monthly Target 5 | 183.07 |
Monthly price and volumes Digital Realty
| Date |
Closing |
Open |
Range |
Volume |
Mon 20 October 2025 |
172.92 (0.02%) |
172.53 |
168.45 - 178.30 |
0.4766 times |
Tue 30 September 2025 |
172.88 (3.13%) |
165.09 |
159.22 - 176.15 |
0.8792 times |
Fri 29 August 2025 |
167.64 (-4.99%) |
176.63 |
162.52 - 176.65 |
0.7727 times |
Thu 31 July 2025 |
176.44 (1.21%) |
173.37 |
168.05 - 182.00 |
0.8567 times |
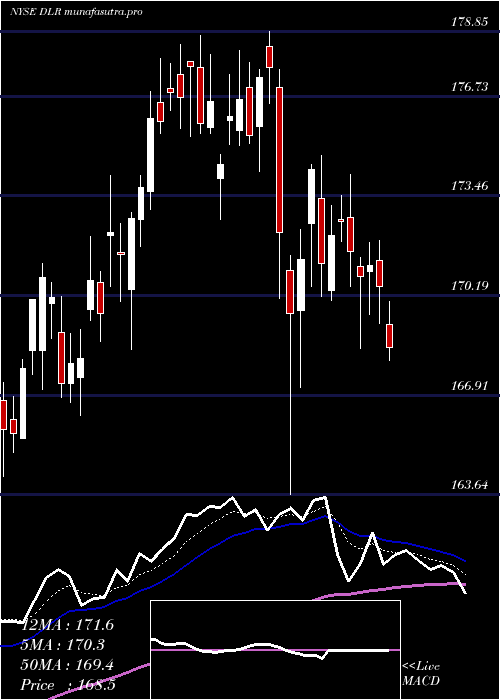
Mon 30 June 2025 |
174.33 (1.64%) |
170.39 |
163.64 - 178.85 |
0.9632 times |
Fri 30 May 2025 |
171.52 (6.84%) |
161.50 |
161.50 - 174.14 |
0.9257 times |
Wed 30 April 2025 |
160.54 (12.04%) |
144.09 |
129.95 - 164.48 |
1.2723 times |
Mon 31 March 2025 |
143.29 (-8.34%) |
158.34 |
139.27 - 159.06 |
1.2837 times |
Fri 28 February 2025 |
156.32 (-4.6%) |
161.64 |
154.73 - 172.11 |
1.2424 times |
Fri 31 January 2025 |
163.86 (-7.6%) |
177.69 |
156.09 - 187.74 |
1.3275 times |
Tue 31 December 2024 |
177.33 (-8.6%) |
192.40 |
174.46 - 194.22 |
0.7463 times |
DMA SMA EMA moving averages of Digital Realty DLR
DMA (daily moving average) of Digital Realty DLR
| DMA period | DMA value | | 5 day DMA | 173.34 | | 12 day DMA | 173.72 | | 20 day DMA | 173.09 | | 35 day DMA | 171.36 | | 50 day DMA | 170.08 | | 100 day DMA | 172.08 | | 150 day DMA | 166.42 | | 200 day DMA | 166.17 | EMA (exponential moving average) of Digital Realty DLR
| EMA period | EMA current | EMA prev | EMA prev2 | | 5 day EMA | 173.11 | 173.21 | 173.45 | | 12 day EMA | 173.11 | 173.14 | 173.22 | | 20 day EMA | 172.76 | 172.74 | 172.74 | | 35 day EMA | 171.65 | 171.57 | 171.5 | | 50 day EMA | 170.41 | 170.31 | 170.21 |
SMA (simple moving average) of Digital Realty DLR
| SMA period | SMA current | SMA prev | SMA prev2 | | 5 day SMA | 173.34 | 173.07 | 172.22 | | 12 day SMA | 173.72 | 173.79 | 173.68 | | 20 day SMA | 173.09 | 173.18 | 173.14 | | 35 day SMA | 171.36 | 171.21 | 171.07 | | 50 day SMA | 170.08 | 169.99 | 169.94 | | 100 day SMA | 172.08 | 172.05 | 172.01 | | 150 day SMA | 166.42 | 166.28 | 166.12 | | 200 day SMA | 166.17 | 166.22 | 166.24 |
|
|
