DynagasLng DLN-A full analysis,charts,indicators,moving averages,SMA,DMA,EMA,ADX,MACD,RSIDynagas Lng DLN-A WideScreen charts, DMA,SMA,EMA technical analysis, forecast prediction, by indicators ADX,MACD,RSI,CCI NYSE stock exchange
Daily price and charts and targets DynagasLng Strong Daily Stock price targets for DynagasLng DLN-A are 26.43 and 26.51 | Daily Target 1 | 26.41 | | Daily Target 2 | 26.44 | | Daily Target 3 | 26.486666666667 | | Daily Target 4 | 26.52 | | Daily Target 5 | 26.57 |
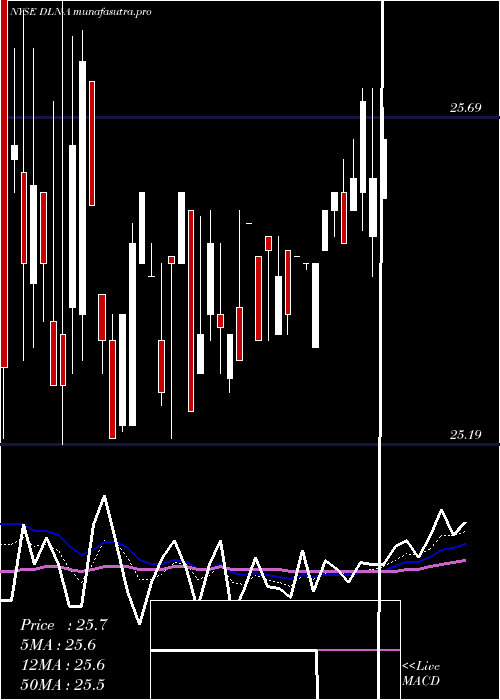
Daily price and volume Dynagas Lng
| Date |
Closing |
Open |
Range |
Volume |
Thu 04 December 2025 |
26.48 (0.3%) |
26.50 |
26.45 - 26.53 |
0.8032 times |
Wed 03 December 2025 |
26.40 (0.38%) |
26.30 |
26.20 - 26.40 |
1.245 times |
Tue 02 December 2025 |
26.30 (-0.38%) |
26.27 |
26.20 - 26.50 |
1.3655 times |
Mon 01 December 2025 |
26.40 (0.27%) |
26.39 |
26.39 - 26.40 |
1.3655 times |
Fri 28 November 2025 |
26.33 (1.23%) |
26.33 |
26.33 - 26.33 |
0.2008 times |
Wed 26 November 2025 |
26.01 (-1.14%) |
26.39 |
26.01 - 26.39 |
0.4016 times |
Tue 25 November 2025 |
26.31 (0.27%) |
26.22 |
26.22 - 26.35 |
1.0442 times |
Mon 24 November 2025 |
26.24 (0.54%) |
26.03 |
26.03 - 26.37 |
1.7269 times |
Fri 21 November 2025 |
26.10 (-0.61%) |
26.25 |
26.10 - 26.25 |
0.1205 times |
Thu 20 November 2025 |
26.26 (0.04%) |
26.26 |
26.26 - 26.26 |
1.7269 times |
Wed 19 November 2025 |
26.25 (0.19%) |
26.24 |
26.23 - 26.26 |
0.4016 times |
Weekly price and charts DynagasLng Strong weekly Stock price targets for DynagasLng DLN-A are 26.34 and 26.67 | Weekly Target 1 | 26.07 | | Weekly Target 2 | 26.28 | | Weekly Target 3 | 26.403333333333 | | Weekly Target 4 | 26.61 | | Weekly Target 5 | 26.73 |
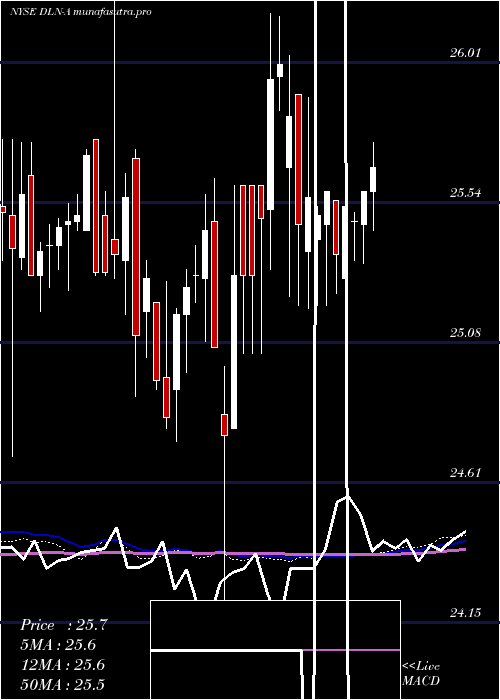
Weekly price and volumes for Dynagas Lng
| Date |
Closing |
Open |
Range |
Volume |
Thu 04 December 2025 |
26.48 (0.57%) |
26.39 |
26.20 - 26.53 |
1.1216 times |
Fri 28 November 2025 |
26.33 (0.88%) |
26.03 |
26.01 - 26.39 |
0.7917 times |
Fri 21 November 2025 |
26.10 (-0.68%) |
26.26 |
26.10 - 26.26 |
0.6975 times |
Fri 14 November 2025 |
26.28 (0.31%) |
26.14 |
26.00 - 26.48 |
0.8671 times |
Fri 07 November 2025 |
26.20 (-1.09%) |
26.20 |
26.00 - 26.30 |
0.5467 times |
Fri 31 October 2025 |
26.49 (0%) |
26.59 |
26.40 - 26.59 |
0.1508 times |
Fri 31 October 2025 |
26.49 (0.8%) |
26.26 |
25.99 - 26.59 |
1.2724 times |
Fri 24 October 2025 |
26.28 (0.5%) |
26.13 |
26.12 - 26.60 |
1.3949 times |
Thu 16 October 2025 |
26.15 (-1.43%) |
26.56 |
26.10 - 26.70 |
2.1301 times |
Fri 10 October 2025 |
26.53 (-1.01%) |
26.74 |
26.30 - 26.74 |
1.0273 times |
Wed 01 October 2025 |
26.80 (1.06%) |
26.41 |
26.26 - 26.97 |
0.3016 times |
Monthly price and charts DynagasLng Strong monthly Stock price targets for DynagasLng DLN-A are 26.34 and 26.67 | Monthly Target 1 | 26.07 | | Monthly Target 2 | 26.28 | | Monthly Target 3 | 26.403333333333 | | Monthly Target 4 | 26.61 | | Monthly Target 5 | 26.73 |
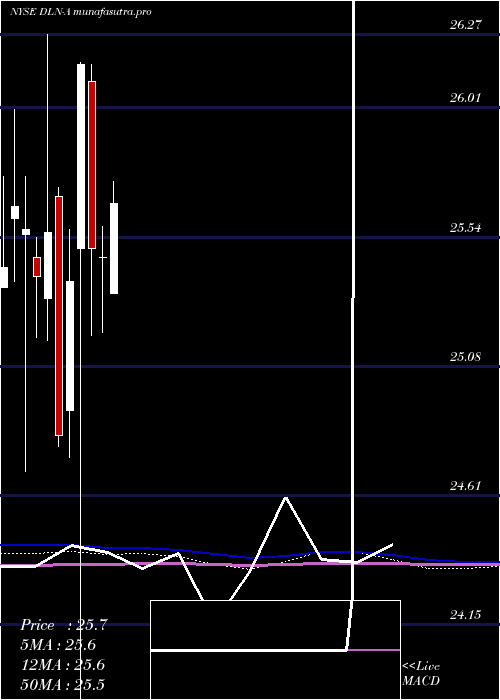
Monthly price and volumes Dynagas Lng
| Date |
Closing |
Open |
Range |
Volume |
Thu 04 December 2025 |
26.48 (0.57%) |
26.39 |
26.20 - 26.53 |
0.146 times |
Fri 28 November 2025 |
26.33 (-0.6%) |
26.20 |
26.00 - 26.48 |
0.378 times |
Fri 31 October 2025 |
26.49 (-1.78%) |
26.80 |
25.99 - 26.80 |
0.7806 times |
Tue 30 September 2025 |
26.97 (3.41%) |
26.18 |
26.00 - 26.97 |
0.5572 times |
Fri 29 August 2025 |
26.08 (-2.1%) |
26.60 |
25.76 - 28.77 |
1.5378 times |
Thu 31 July 2025 |
26.64 (4.59%) |
25.34 |
25.34 - 26.89 |
1.9014 times |
Mon 30 June 2025 |
25.47 (-0.12%) |
25.47 |
25.20 - 25.58 |
0.5866 times |
Fri 30 May 2025 |
25.50 (-2.52%) |
26.10 |
25.19 - 26.16 |
1.1401 times |
Wed 30 April 2025 |
26.16 (3.07%) |
25.50 |
23.22 - 26.17 |
1.5884 times |
Mon 31 March 2025 |
25.38 (2.22%) |
24.92 |
24.75 - 25.57 |
1.3838 times |
Fri 28 February 2025 |
24.83 (-2.86%) |
25.69 |
24.79 - 25.72 |
3.0842 times |
DMA SMA EMA moving averages of Dynagas Lng DLN-A
DMA (daily moving average) of Dynagas Lng DLN-A
| DMA period | DMA value | | 5 day DMA | 26.38 | | 12 day DMA | 26.27 | | 20 day DMA | 26.25 | | 35 day DMA | 26.26 | | 50 day DMA | 26.34 | | 100 day DMA | 26.27 | | 150 day DMA | 26.03 | | 200 day DMA | 25.81 | EMA (exponential moving average) of Dynagas Lng DLN-A
| EMA period | EMA current | EMA prev | EMA prev2 | | 5 day EMA | 26.38 | 26.33 | 26.29 | | 12 day EMA | 26.31 | 26.28 | 26.26 | | 20 day EMA | 26.29 | 26.27 | 26.26 | | 35 day EMA | 26.32 | 26.31 | 26.3 | | 50 day EMA | 26.34 | 26.33 | 26.33 |
SMA (simple moving average) of Dynagas Lng DLN-A
| SMA period | SMA current | SMA prev | SMA prev2 | | 5 day SMA | 26.38 | 26.29 | 26.27 | | 12 day SMA | 26.27 | 26.25 | 26.24 | | 20 day SMA | 26.25 | 26.23 | 26.21 | | 35 day SMA | 26.26 | 26.25 | 26.25 | | 50 day SMA | 26.34 | 26.33 | 26.33 | | 100 day SMA | 26.27 | 26.26 | 26.25 | | 150 day SMA | 26.03 | 26.02 | 26.02 | | 200 day SMA | 25.81 | 25.8 | 25.8 |
|
|
