DickS DKS full analysis,charts,indicators,moving averages,SMA,DMA,EMA,ADX,MACD,RSIDick S DKS WideScreen charts, DMA,SMA,EMA technical analysis, forecast prediction, by indicators ADX,MACD,RSI,CCI NYSE stock exchange
operates under Consumer Services sector & deals in Other Specialty Stores
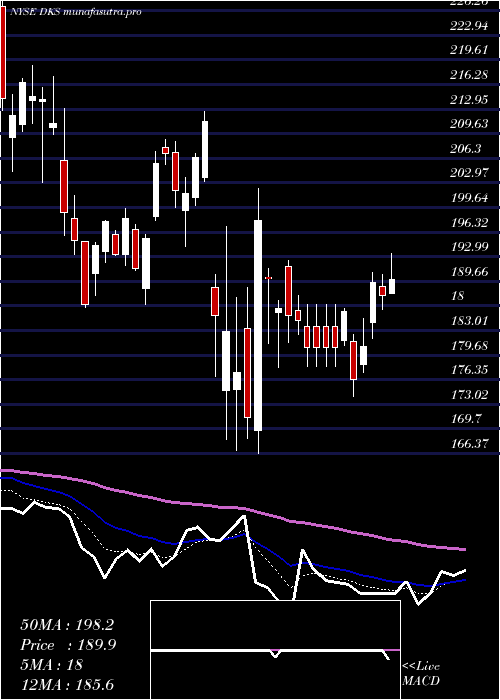
Daily price and charts and targets DickS Strong Daily Stock price targets for DickS DKS are 221.28 and 227.14 | Daily Target 1 | 219.71 | | Daily Target 2 | 222.84 | | Daily Target 3 | 225.57333333333 | | Daily Target 4 | 228.7 | | Daily Target 5 | 231.43 |
Daily price and volume Dick S
| Date |
Closing |
Open |
Range |
Volume |
Thu 04 December 2025 |
225.96 (-0.87%) |
227.46 |
222.45 - 228.31 |
0.5527 times |
Wed 03 December 2025 |
227.94 (8.8%) |
211.52 |
209.81 - 228.21 |
1.1623 times |
Tue 02 December 2025 |
209.50 (0.63%) |
211.03 |
208.10 - 213.67 |
0.3748 times |
Mon 01 December 2025 |
208.19 (0.78%) |
205.00 |
203.55 - 213.73 |
1.0517 times |
Fri 28 November 2025 |
206.57 (-0.4%) |
209.74 |
202.07 - 209.74 |
0.7569 times |
Wed 26 November 2025 |
207.41 (0.33%) |
204.00 |
202.89 - 211.87 |
1.3482 times |
Tue 25 November 2025 |
206.73 (0.04%) |
199.50 |
197.18 - 215.74 |
3.0418 times |
Mon 24 November 2025 |
206.65 (-0.86%) |
210.00 |
205.88 - 210.23 |
0.5403 times |
Fri 21 November 2025 |
208.45 (2.88%) |
202.82 |
202.82 - 212.58 |
0.6825 times |
Thu 20 November 2025 |
202.61 (-2.14%) |
210.02 |
202.48 - 211.34 |
0.4889 times |
Wed 19 November 2025 |
207.04 (-1.49%) |
210.31 |
205.19 - 212.61 |
0.39 times |
Weekly price and charts DickS Strong weekly Stock price targets for DickS DKS are 214.76 and 239.52 | Weekly Target 1 | 194.51 | | Weekly Target 2 | 210.24 | | Weekly Target 3 | 219.27333333333 | | Weekly Target 4 | 235 | | Weekly Target 5 | 244.03 |
Weekly price and volumes for Dick S
| Date |
Closing |
Open |
Range |
Volume |
Thu 04 December 2025 |
225.96 (9.39%) |
205.00 |
203.55 - 228.31 |
1.322 times |
Fri 28 November 2025 |
206.57 (-0.9%) |
210.00 |
197.18 - 215.74 |
2.3933 times |
Fri 21 November 2025 |
208.45 (-3.65%) |
214.93 |
202.48 - 214.93 |
1.0938 times |
Fri 14 November 2025 |
216.35 (-1.26%) |
221.33 |
214.37 - 226.50 |
0.7904 times |
Fri 07 November 2025 |
219.11 (-1.06%) |
215.15 |
213.46 - 226.40 |
0.701 times |
Fri 31 October 2025 |
221.45 (0%) |
221.42 |
215.44 - 221.47 |
0.2748 times |
Fri 31 October 2025 |
221.45 (-1.74%) |
230.20 |
215.44 - 234.87 |
0.9842 times |
Fri 24 October 2025 |
225.38 (-1.52%) |
229.83 |
224.24 - 232.35 |
0.6112 times |
Fri 17 October 2025 |
228.86 (8.17%) |
217.38 |
216.17 - 236.87 |
0.9904 times |
Fri 10 October 2025 |
211.58 (-8.57%) |
232.30 |
211.58 - 233.05 |
0.8388 times |
Fri 03 October 2025 |
231.41 (1.38%) |
228.00 |
216.02 - 237.31 |
1.2645 times |
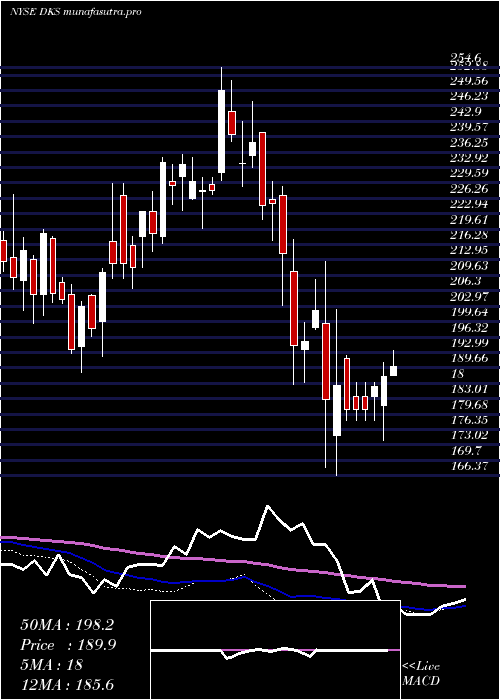
Monthly price and charts DickS Strong monthly Stock price targets for DickS DKS are 214.76 and 239.52 | Monthly Target 1 | 194.51 | | Monthly Target 2 | 210.24 | | Monthly Target 3 | 219.27333333333 | | Monthly Target 4 | 235 | | Monthly Target 5 | 244.03 |
Monthly price and volumes Dick S
| Date |
Closing |
Open |
Range |
Volume |
Thu 04 December 2025 |
225.96 (9.39%) |
205.00 |
203.55 - 228.31 |
0.2371 times |
Fri 28 November 2025 |
206.57 (-6.72%) |
215.15 |
197.18 - 226.50 |
0.893 times |
Fri 31 October 2025 |
221.45 (-0.35%) |
222.28 |
211.58 - 237.31 |
0.7797 times |
Tue 30 September 2025 |
222.22 (4.43%) |
211.00 |
205.88 - 234.30 |
1.2427 times |
Fri 29 August 2025 |
212.80 (0.61%) |
207.00 |
202.52 - 232.27 |
1.3319 times |
Thu 31 July 2025 |
211.51 (6.93%) |
200.00 |
198.04 - 220.89 |
0.8944 times |
Mon 30 June 2025 |
197.81 (10.3%) |
178.49 |
170.73 - 206.72 |
0.9648 times |
Fri 30 May 2025 |
179.34 (-4.47%) |
189.67 |
167.03 - 224.64 |
1.5347 times |
Wed 30 April 2025 |
187.74 (-6.86%) |
200.98 |
166.37 - 212.62 |
0.9865 times |
Mon 31 March 2025 |
201.56 (-10.46%) |
226.84 |
186.09 - 228.81 |
1.135 times |
Fri 28 February 2025 |
225.10 (-6.23%) |
233.87 |
217.09 - 247.19 |
0.5828 times |

DMA SMA EMA moving averages of Dick S DKS
DMA (daily moving average) of Dick S DKS
| DMA period | DMA value | | 5 day DMA | 215.63 | | 12 day DMA | 210.6 | | 20 day DMA | 213.45 | | 35 day DMA | 218.48 | | 50 day DMA | 220.94 | | 100 day DMA | 220.03 | | 150 day DMA | 209.77 | | 200 day DMA | 207.03 | EMA (exponential moving average) of Dick S DKS
| EMA period | EMA current | EMA prev | EMA prev2 | | 5 day EMA | 218.5 | 214.77 | 208.18 | | 12 day EMA | 214.53 | 212.45 | 209.63 | | 20 day EMA | 214.89 | 213.72 | 212.22 | | 35 day EMA | 217.25 | 216.74 | 216.08 | | 50 day EMA | 220.88 | 220.67 | 220.37 |
SMA (simple moving average) of Dick S DKS
| SMA period | SMA current | SMA prev | SMA prev2 | | 5 day SMA | 215.63 | 211.92 | 207.68 | | 12 day SMA | 210.6 | 209.19 | 208.22 | | 20 day SMA | 213.45 | 213.1 | 212.51 | | 35 day SMA | 218.48 | 218.71 | 218.78 | | 50 day SMA | 220.94 | 221.03 | 221.04 | | 100 day SMA | 220.03 | 219.83 | 219.64 | | 150 day SMA | 209.77 | 209.51 | 209.27 | | 200 day SMA | 207.03 | 207.07 | 207.13 |
|
|
