DanaherCorporation DHR full analysis,charts,indicators,moving averages,SMA,DMA,EMA,ADX,MACD,RSIDanaher Corporation DHR WideScreen charts, DMA,SMA,EMA technical analysis, forecast prediction, by indicators ADX,MACD,RSI,CCI NYSE stock exchange
operates under Capital Goods sector & deals in Industrial Machinery Components
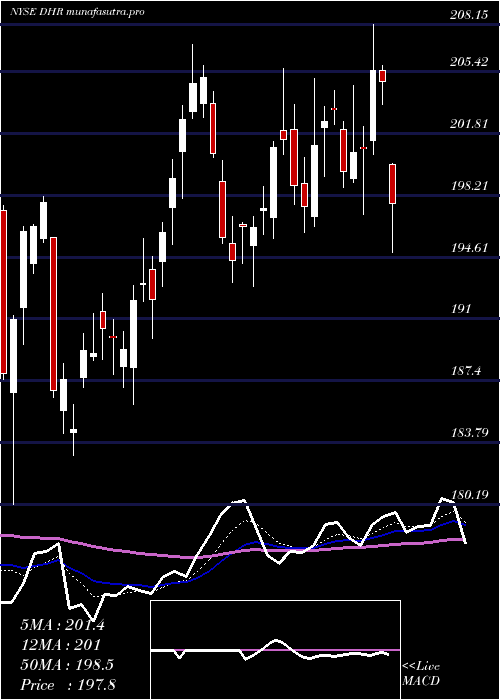
Daily price and charts and targets DanaherCorporation Strong Daily Stock price targets for DanaherCorporation DHR are 206.1 and 209.92 | Daily Target 1 | 205.37 | | Daily Target 2 | 206.83 | | Daily Target 3 | 209.19333333333 | | Daily Target 4 | 210.65 | | Daily Target 5 | 213.01 |
Daily price and volume Danaher Corporation
| Date |
Closing |
Open |
Range |
Volume |
Mon 20 October 2025 |
208.28 (-0.37%) |
210.25 |
207.74 - 211.56 |
0.7753 times |
Fri 17 October 2025 |
209.06 (-0.88%) |
210.46 |
208.65 - 212.64 |
1.1669 times |
Thu 16 October 2025 |
210.92 (2.34%) |
209.60 |
205.48 - 211.59 |
1.637 times |
Wed 15 October 2025 |
206.10 (-0.02%) |
206.98 |
204.44 - 209.52 |
0.8669 times |
Tue 14 October 2025 |
206.15 (0.49%) |
202.88 |
202.33 - 207.36 |
0.6342 times |
Mon 13 October 2025 |
205.14 (1.32%) |
203.56 |
202.85 - 206.75 |
0.6273 times |
Fri 10 October 2025 |
202.46 (-0.99%) |
204.91 |
202.14 - 206.46 |
1.0088 times |
Thu 09 October 2025 |
204.48 (-0.23%) |
204.81 |
203.56 - 207.19 |
0.7238 times |
Wed 08 October 2025 |
204.96 (-1.82%) |
206.90 |
204.90 - 209.88 |
1.432 times |
Tue 07 October 2025 |
208.77 (-1.39%) |
212.51 |
208.46 - 213.96 |
1.1279 times |
Mon 06 October 2025 |
211.71 (-1.53%) |
215.98 |
210.64 - 216.59 |
0.7077 times |
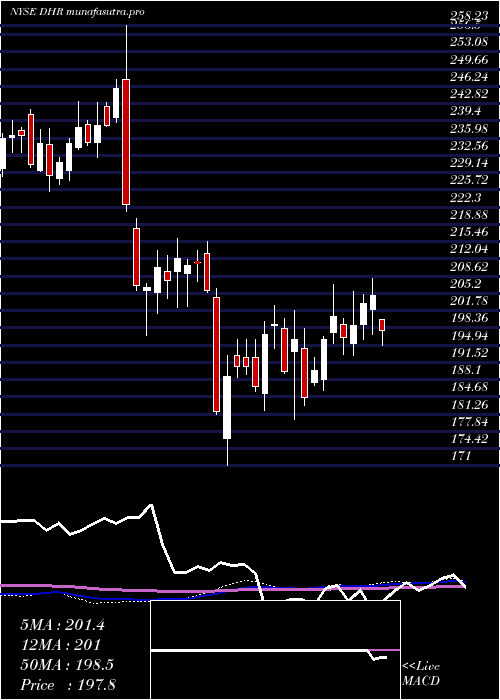
Weekly price and charts DanaherCorporation Strong weekly Stock price targets for DanaherCorporation DHR are 206.1 and 209.92 | Weekly Target 1 | 205.37 | | Weekly Target 2 | 206.83 | | Weekly Target 3 | 209.19333333333 | | Weekly Target 4 | 210.65 | | Weekly Target 5 | 213.01 |
Weekly price and volumes for Danaher Corporation
| Date |
Closing |
Open |
Range |
Volume |
Mon 20 October 2025 |
208.28 (-0.37%) |
210.25 |
207.74 - 211.56 |
0.1669 times |
Fri 17 October 2025 |
209.06 (3.26%) |
203.56 |
202.33 - 212.64 |
1.062 times |
Fri 10 October 2025 |
202.46 (-5.83%) |
215.98 |
202.14 - 216.59 |
1.0766 times |
Fri 03 October 2025 |
214.99 (16.31%) |
185.85 |
183.45 - 219.92 |
2.0225 times |
Fri 26 September 2025 |
184.84 (-4.37%) |
191.90 |
180.03 - 193.09 |
1.4669 times |
Fri 19 September 2025 |
193.29 (1.7%) |
191.06 |
187.04 - 196.50 |
1.3763 times |
Fri 12 September 2025 |
190.05 (-5.07%) |
195.67 |
188.86 - 199.15 |
1.1925 times |
Fri 05 September 2025 |
200.21 (-2.73%) |
204.56 |
192.18 - 206.00 |
0.7493 times |
Fri 29 August 2025 |
205.82 (0%) |
205.34 |
204.70 - 207.70 |
0.1199 times |
Fri 29 August 2025 |
205.82 (-2.82%) |
211.30 |
202.02 - 211.73 |
0.7669 times |
Fri 22 August 2025 |
211.80 (0.41%) |
211.00 |
203.89 - 214.01 |
1.0633 times |
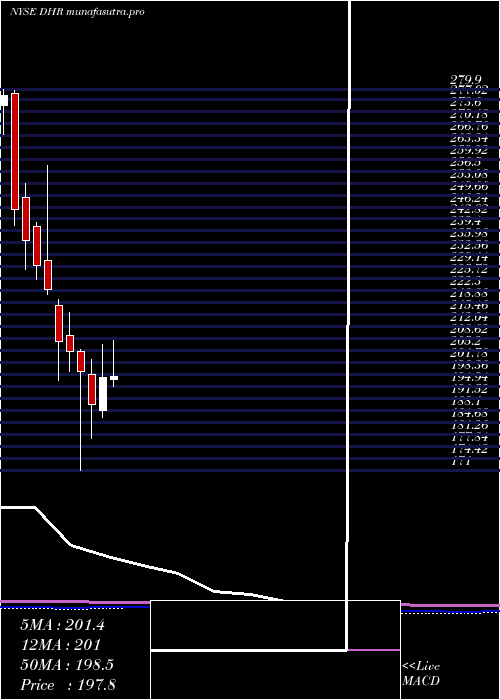
Monthly price and charts DanaherCorporation Strong monthly Stock price targets for DanaherCorporation DHR are 203.46 and 224.75 | Monthly Target 1 | 187.65 | | Monthly Target 2 | 197.97 | | Monthly Target 3 | 208.94333333333 | | Monthly Target 4 | 219.26 | | Monthly Target 5 | 230.23 |
Monthly price and volumes Danaher Corporation
| Date |
Closing |
Open |
Range |
Volume |
Mon 20 October 2025 |
208.28 (5.05%) |
198.71 |
198.63 - 219.92 |
0.734 times |
Tue 30 September 2025 |
198.26 (-3.67%) |
204.56 |
180.03 - 206.00 |
1.1002 times |
Fri 29 August 2025 |
205.82 (4.39%) |
195.33 |
192.26 - 214.01 |
0.819 times |
Thu 31 July 2025 |
197.16 (-0.19%) |
196.99 |
185.50 - 208.15 |
1.1752 times |
Mon 30 June 2025 |
197.54 (4.02%) |
188.22 |
186.00 - 207.00 |
0.915 times |
Fri 30 May 2025 |
189.90 (-4.73%) |
198.38 |
180.19 - 202.82 |
0.9927 times |
Wed 30 April 2025 |
199.33 (-2.77%) |
205.00 |
171.00 - 205.48 |
1.0837 times |
Mon 31 March 2025 |
205.00 (-1.33%) |
209.46 |
199.15 - 216.15 |
0.9339 times |
Fri 28 February 2025 |
207.76 (-6.73%) |
218.00 |
196.80 - 219.94 |
1.2805 times |
Fri 31 January 2025 |
222.74 (-2.97%) |
230.85 |
221.34 - 258.23 |
0.9657 times |
Tue 31 December 2024 |
229.55 (-2.97%) |
240.66 |
225.42 - 241.67 |
0.6231 times |
DMA SMA EMA moving averages of Danaher Corporation DHR
DMA (daily moving average) of Danaher Corporation DHR
| DMA period | DMA value | | 5 day DMA | 208.1 | | 12 day DMA | 207.75 | | 20 day DMA | 202.11 | | 35 day DMA | 199.04 | | 50 day DMA | 201.73 | | 100 day DMA | 199.82 | | 150 day DMA | 198.45 | | 200 day DMA | 204.1 | EMA (exponential moving average) of Danaher Corporation DHR
| EMA period | EMA current | EMA prev | EMA prev2 | | 5 day EMA | 208.07 | 207.96 | 207.41 | | 12 day EMA | 206.14 | 205.75 | 205.15 | | 20 day EMA | 204.13 | 203.69 | 203.13 | | 35 day EMA | 203.17 | 202.87 | 202.51 | | 50 day EMA | 202.11 | 201.86 | 201.57 |
SMA (simple moving average) of Danaher Corporation DHR
| SMA period | SMA current | SMA prev | SMA prev2 | | 5 day SMA | 208.1 | 207.47 | 206.15 | | 12 day SMA | 207.75 | 207.9 | 208.21 | | 20 day SMA | 202.11 | 201.22 | 200.43 | | 35 day SMA | 199.04 | 198.97 | 198.88 | | 50 day SMA | 201.73 | 201.56 | 201.39 | | 100 day SMA | 199.82 | 199.63 | 199.39 | | 150 day SMA | 198.45 | 198.43 | 198.4 | | 200 day SMA | 204.1 | 204.2 | 204.31 |
|
|
