DollarGeneral DG full analysis,charts,indicators,moving averages,SMA,DMA,EMA,ADX,MACD,RSIDollar General DG WideScreen charts, DMA,SMA,EMA technical analysis, forecast prediction, by indicators ADX,MACD,RSI,CCI NYSE stock exchange
operates under Consumer Services sector & deals in Department Specialty Retail Stores
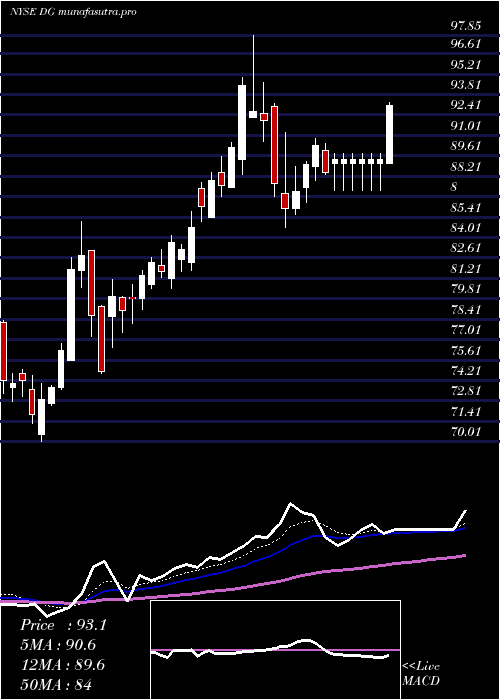
Daily price and charts and targets DollarGeneral Strong Daily Stock price targets for DollarGeneral DG are 105.03 and 106.52 | Daily Target 1 | 103.8 | | Daily Target 2 | 104.77 | | Daily Target 3 | 105.29 | | Daily Target 4 | 106.26 | | Daily Target 5 | 106.78 |
Daily price and volume Dollar General
| Date |
Closing |
Open |
Range |
Volume |
Fri 17 October 2025 |
105.74 (1.79%) |
104.67 |
104.32 - 105.81 |
0.6675 times |
Thu 16 October 2025 |
103.88 (-2.29%) |
106.25 |
103.43 - 107.25 |
1.0865 times |
Wed 15 October 2025 |
106.32 (2.52%) |
104.42 |
103.56 - 107.03 |
1.3787 times |
Tue 14 October 2025 |
103.71 (1.81%) |
102.25 |
101.10 - 103.94 |
1.045 times |
Mon 13 October 2025 |
101.87 (2.67%) |
98.77 |
98.52 - 102.12 |
1.061 times |
Fri 10 October 2025 |
99.22 (0.56%) |
99.00 |
98.10 - 100.53 |
0.9498 times |
Thu 09 October 2025 |
98.67 (0.52%) |
98.58 |
97.15 - 99.00 |
0.9403 times |
Wed 08 October 2025 |
98.16 (1.86%) |
96.73 |
96.51 - 99.23 |
1.0665 times |
Tue 07 October 2025 |
96.37 (-2.06%) |
97.41 |
95.34 - 97.70 |
1.0957 times |
Mon 06 October 2025 |
98.40 (-1.79%) |
100.08 |
98.07 - 100.53 |
0.709 times |
Fri 03 October 2025 |
100.19 (-1.19%) |
101.67 |
99.73 - 101.67 |
0.8629 times |
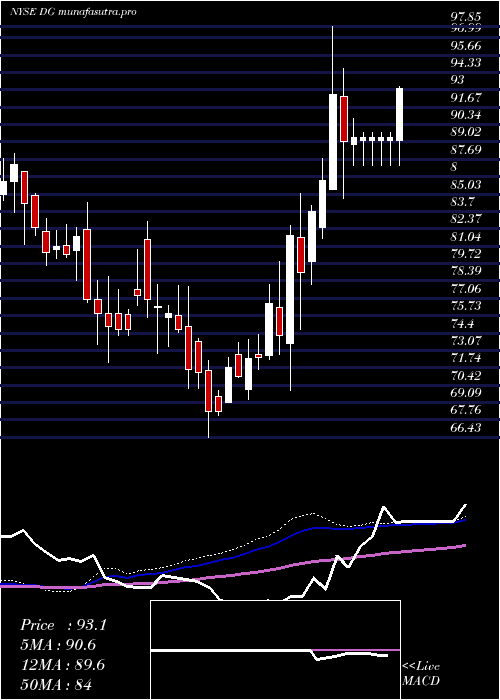
Weekly price and charts DollarGeneral Strong weekly Stock price targets for DollarGeneral DG are 102.13 and 110.86 | Weekly Target 1 | 95.11 | | Weekly Target 2 | 100.42 | | Weekly Target 3 | 103.83666666667 | | Weekly Target 4 | 109.15 | | Weekly Target 5 | 112.57 |
Weekly price and volumes for Dollar General
| Date |
Closing |
Open |
Range |
Volume |
Fri 17 October 2025 |
105.74 (6.57%) |
98.77 |
98.52 - 107.25 |
1.122 times |
Fri 10 October 2025 |
99.22 (-0.97%) |
100.08 |
95.34 - 100.53 |
1.0197 times |
Fri 03 October 2025 |
100.19 (-1.89%) |
102.60 |
98.70 - 103.83 |
1.1641 times |
Fri 26 September 2025 |
102.12 (0.01%) |
102.10 |
99.90 - 105.93 |
0.991 times |
Fri 19 September 2025 |
102.11 (-2.19%) |
104.06 |
101.04 - 107.34 |
1.2534 times |
Fri 12 September 2025 |
104.40 (-4.47%) |
110.57 |
103.72 - 110.70 |
1.1266 times |
Fri 05 September 2025 |
109.28 (0.48%) |
109.75 |
106.64 - 110.93 |
0.6847 times |
Fri 29 August 2025 |
108.76 (0%) |
112.31 |
107.42 - 113.82 |
0.3137 times |
Fri 29 August 2025 |
108.76 (-3.24%) |
112.20 |
105.69 - 115.00 |
1.4473 times |
Fri 22 August 2025 |
112.40 (-0.33%) |
113.58 |
111.37 - 115.91 |
0.8775 times |
Fri 15 August 2025 |
112.77 (-3.05%) |
116.65 |
112.07 - 117.48 |
0.9487 times |
Monthly price and charts DollarGeneral Strong monthly Stock price targets for DollarGeneral DG are 100.54 and 112.45 | Monthly Target 1 | 90.87 | | Monthly Target 2 | 98.3 | | Monthly Target 3 | 102.77666666667 | | Monthly Target 4 | 110.21 | | Monthly Target 5 | 114.69 |
Monthly price and volumes Dollar General
| Date |
Closing |
Open |
Range |
Volume |
Fri 17 October 2025 |
105.74 (2.31%) |
103.26 |
95.34 - 107.25 |
0.5648 times |
Tue 30 September 2025 |
103.35 (-4.97%) |
109.75 |
99.90 - 110.93 |
0.9248 times |
Fri 29 August 2025 |
108.76 (3.68%) |
105.32 |
105.06 - 117.95 |
0.9357 times |
Thu 31 July 2025 |
104.90 (-8.29%) |
114.24 |
104.50 - 116.30 |
0.7898 times |
Mon 30 June 2025 |
114.38 (17.61%) |
97.30 |
96.36 - 115.11 |
1.0706 times |
Fri 30 May 2025 |
97.25 (3.8%) |
93.16 |
86.25 - 102.69 |
1.0419 times |
Wed 30 April 2025 |
93.69 (6.55%) |
88.48 |
84.70 - 97.85 |
1.4364 times |
Mon 31 March 2025 |
87.93 (18.54%) |
73.57 |
70.01 - 88.50 |
1.2421 times |
Fri 28 February 2025 |
74.18 (4.39%) |
70.09 |
69.32 - 79.88 |
0.8784 times |
Fri 31 January 2025 |
71.06 (-6.28%) |
76.30 |
66.43 - 78.04 |
1.1155 times |
Tue 31 December 2024 |
75.82 (1.58%) |
77.77 |
72.81 - 82.97 |
0.8453 times |

DMA SMA EMA moving averages of Dollar General DG
DMA (daily moving average) of Dollar General DG
| DMA period | DMA value | | 5 day DMA | 104.3 | | 12 day DMA | 101.16 | | 20 day DMA | 101.75 | | 35 day DMA | 103.86 | | 50 day DMA | 106.55 | | 100 day DMA | 108.49 | | 150 day DMA | 102.61 | | 200 day DMA | 95.41 | EMA (exponential moving average) of Dollar General DG
| EMA period | EMA current | EMA prev | EMA prev2 | | 5 day EMA | 104.05 | 103.21 | 102.87 | | 12 day EMA | 102.65 | 102.09 | 101.76 | | 20 day EMA | 102.81 | 102.5 | 102.35 | | 35 day EMA | 104.53 | 104.46 | 104.49 | | 50 day EMA | 106.85 | 106.9 | 107.02 |
SMA (simple moving average) of Dollar General DG
| SMA period | SMA current | SMA prev | SMA prev2 | | 5 day SMA | 104.3 | 103 | 101.96 | | 12 day SMA | 101.16 | 100.66 | 100.61 | | 20 day SMA | 101.75 | 101.56 | 101.71 | | 35 day SMA | 103.86 | 103.94 | 104.17 | | 50 day SMA | 106.55 | 106.76 | 106.99 | | 100 day SMA | 108.49 | 108.45 | 108.42 | | 150 day SMA | 102.61 | 102.43 | 102.27 | | 200 day SMA | 95.41 | 95.26 | 95.11 |
|
|
