DellTechnologies DELL full analysis,charts,indicators,moving averages,SMA,DMA,EMA,ADX,MACD,RSIDell Technologies DELL WideScreen charts, DMA,SMA,EMA technical analysis, forecast prediction, by indicators ADX,MACD,RSI,CCI NYSE stock exchange
operates under Technology sector & deals in Computer Manufacturing
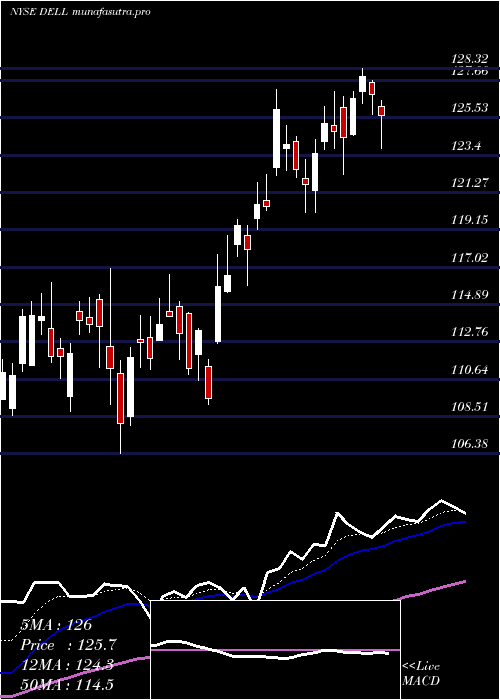
Daily price and charts and targets DellTechnologies Strong Daily Stock price targets for DellTechnologies DELL are 135.66 and 139.3 | Daily Target 1 | 134.6 | | Daily Target 2 | 136.72 | | Daily Target 3 | 138.23666666667 | | Daily Target 4 | 140.36 | | Daily Target 5 | 141.88 |
Daily price and volume Dell Technologies
| Date |
Closing |
Open |
Range |
Volume |
Fri 05 December 2025 |
138.85 (-0.09%) |
139.10 |
136.11 - 139.75 |
0.4161 times |
Thu 04 December 2025 |
138.98 (4%) |
134.30 |
132.61 - 139.31 |
0.642 times |
Wed 03 December 2025 |
133.63 (-1.71%) |
135.40 |
133.24 - 136.11 |
0.9431 times |
Tue 02 December 2025 |
135.95 (2.92%) |
132.24 |
131.86 - 138.04 |
0.6924 times |
Mon 01 December 2025 |
132.09 (-0.94%) |
131.71 |
127.77 - 132.14 |
1.1252 times |
Fri 28 November 2025 |
133.35 (0.11%) |
134.17 |
130.01 - 134.50 |
0.9401 times |
Wed 26 November 2025 |
133.20 (5.73%) |
131.82 |
125.92 - 135.35 |
1.8962 times |
Tue 25 November 2025 |
125.98 (-0.99%) |
127.30 |
123.00 - 127.71 |
1.1136 times |
Mon 24 November 2025 |
127.24 (3.86%) |
123.31 |
123.00 - 129.41 |
0.8255 times |
Fri 21 November 2025 |
122.51 (4.35%) |
118.56 |
116.56 - 123.46 |
1.4058 times |
Thu 20 November 2025 |
117.40 (-1.66%) |
123.65 |
116.75 - 125.68 |
1.4831 times |
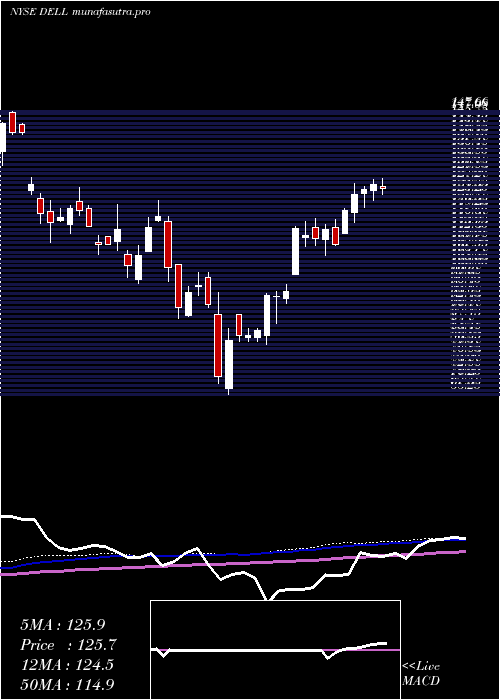
Weekly price and charts DellTechnologies Strong weekly Stock price targets for DellTechnologies DELL are 133.31 and 145.29 | Weekly Target 1 | 123.48 | | Weekly Target 2 | 131.16 | | Weekly Target 3 | 135.45666666667 | | Weekly Target 4 | 143.14 | | Weekly Target 5 | 147.44 |
Weekly price and volumes for Dell Technologies
| Date |
Closing |
Open |
Range |
Volume |
Fri 05 December 2025 |
138.85 (4.12%) |
131.71 |
127.77 - 139.75 |
0.7974 times |
Fri 28 November 2025 |
133.35 (8.85%) |
123.31 |
123.00 - 135.35 |
0.9971 times |
Fri 21 November 2025 |
122.51 (-8.41%) |
124.00 |
116.56 - 128.41 |
1.6192 times |
Fri 14 November 2025 |
133.76 (-8.82%) |
149.74 |
129.33 - 150.05 |
0.9902 times |
Fri 07 November 2025 |
146.70 (-9.45%) |
156.53 |
143.08 - 157.92 |
0.5136 times |
Fri 31 October 2025 |
162.01 (0%) |
162.94 |
158.00 - 163.38 |
0.1427 times |
Fri 31 October 2025 |
162.01 (2.11%) |
160.50 |
158.00 - 167.94 |
0.826 times |
Fri 24 October 2025 |
158.66 (5.85%) |
151.16 |
145.09 - 160.50 |
0.6552 times |
Fri 17 October 2025 |
149.89 (-0.45%) |
155.55 |
145.50 - 158.50 |
0.9929 times |
Fri 10 October 2025 |
150.57 (6.04%) |
142.50 |
142.01 - 166.10 |
2.4657 times |
Fri 03 October 2025 |
142.00 (8.6%) |
132.13 |
132.13 - 152.10 |
1.2961 times |
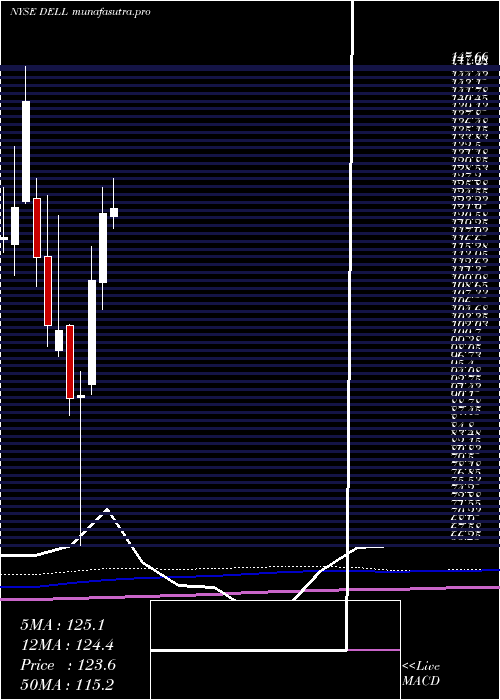
Monthly price and charts DellTechnologies Strong monthly Stock price targets for DellTechnologies DELL are 133.31 and 145.29 | Monthly Target 1 | 123.48 | | Monthly Target 2 | 131.16 | | Monthly Target 3 | 135.45666666667 | | Monthly Target 4 | 143.14 | | Monthly Target 5 | 147.44 |
Monthly price and volumes Dell Technologies
| Date |
Closing |
Open |
Range |
Volume |
Fri 05 December 2025 |
138.85 (4.12%) |
131.71 |
127.77 - 139.75 |
0.1782 times |
Fri 28 November 2025 |
133.35 (-17.69%) |
156.53 |
116.56 - 157.92 |
0.9205 times |
Fri 31 October 2025 |
162.01 (14.28%) |
140.91 |
140.40 - 167.94 |
1.3176 times |
Tue 30 September 2025 |
141.77 (16.06%) |
119.11 |
117.70 - 141.77 |
1.0746 times |
Fri 29 August 2025 |
122.15 (-7.94%) |
128.38 |
119.63 - 142.11 |
1.1141 times |
Thu 31 July 2025 |
132.69 (8.23%) |
122.06 |
120.11 - 136.14 |
0.7888 times |
Mon 30 June 2025 |
122.60 (10.18%) |
110.99 |
106.38 - 127.15 |
0.9149 times |
Fri 30 May 2025 |
111.27 (21.26%) |
93.57 |
91.79 - 116.97 |
1.0592 times |
Wed 30 April 2025 |
91.76 (0.67%) |
91.28 |
66.25 - 95.72 |
1.5322 times |
Mon 31 March 2025 |
91.15 (-11.3%) |
103.64 |
88.33 - 103.77 |
1.1 times |
Fri 28 February 2025 |
102.76 (-0.81%) |
99.38 |
98.37 - 122.26 |
1.3518 times |
DMA SMA EMA moving averages of Dell Technologies DELL
DMA (daily moving average) of Dell Technologies DELL
| DMA period | DMA value | | 5 day DMA | 135.9 | | 12 day DMA | 129.88 | | 20 day DMA | 132.02 | | 35 day DMA | 142.36 | | 50 day DMA | 144.03 | | 100 day DMA | 137.15 | | 150 day DMA | 129.53 | | 200 day DMA | 120.53 | EMA (exponential moving average) of Dell Technologies DELL
| EMA period | EMA current | EMA prev | EMA prev2 | | 5 day EMA | 136.16 | 134.81 | 132.72 | | 12 day EMA | 134 | 133.12 | 132.05 | | 20 day EMA | 135.22 | 134.84 | 134.4 | | 35 day EMA | 137.49 | 137.41 | 137.32 | | 50 day EMA | 142.34 | 142.48 | 142.62 |
SMA (simple moving average) of Dell Technologies DELL
| SMA period | SMA current | SMA prev | SMA prev2 | | 5 day SMA | 135.9 | 134.8 | 133.64 | | 12 day SMA | 129.88 | 128.53 | 127.16 | | 20 day SMA | 132.02 | 132.53 | 133.2 | | 35 day SMA | 142.36 | 142.68 | 143.1 | | 50 day SMA | 144.03 | 143.88 | 143.74 | | 100 day SMA | 137.15 | 137 | 136.87 | | 150 day SMA | 129.53 | 129.22 | 128.9 | | 200 day SMA | 120.53 | 120.44 | 120.31 |
|
|
