DillardS DDS full analysis,charts,indicators,moving averages,SMA,DMA,EMA,ADX,MACD,RSIDillard S DDS WideScreen charts, DMA,SMA,EMA technical analysis, forecast prediction, by indicators ADX,MACD,RSI,CCI NYSE stock exchange
operates under Consumer Services sector & deals in Department Specialty Retail Stores
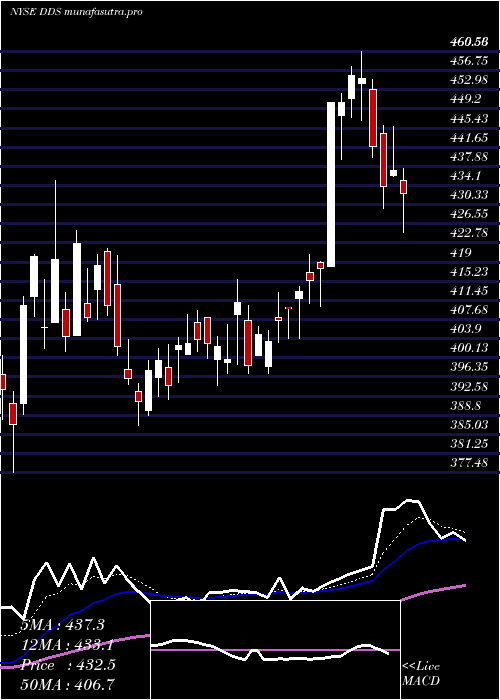
Daily price and charts and targets DillardS Strong Daily Stock price targets for DillardS DDS are 691.49 and 728.7 | Daily Target 1 | 664.45 | | Daily Target 2 | 681.31 | | Daily Target 3 | 701.65666666667 | | Daily Target 4 | 718.52 | | Daily Target 5 | 738.87 |
Daily price and volume Dillard S
| Date |
Closing |
Open |
Range |
Volume |
Fri 05 December 2025 |
698.18 (2.51%) |
687.52 |
684.79 - 722.00 |
0.94 times |
Thu 04 December 2025 |
681.06 (-0.57%) |
678.69 |
675.01 - 692.57 |
0.8854 times |
Wed 03 December 2025 |
684.96 (0.82%) |
674.92 |
674.92 - 699.41 |
0.7234 times |
Tue 02 December 2025 |
679.36 (-0.41%) |
681.13 |
657.12 - 682.05 |
0.9112 times |
Mon 01 December 2025 |
682.18 (1.81%) |
660.63 |
660.20 - 687.49 |
1.3149 times |
Fri 28 November 2025 |
670.06 (-0.2%) |
669.80 |
660.23 - 678.71 |
0.6097 times |
Wed 26 November 2025 |
671.39 (0.72%) |
666.13 |
658.90 - 679.39 |
0.8748 times |
Tue 25 November 2025 |
666.61 (8.5%) |
630.00 |
630.00 - 679.80 |
1.3331 times |
Mon 24 November 2025 |
614.39 (0.46%) |
608.62 |
602.99 - 621.27 |
1.196 times |
Fri 21 November 2025 |
611.56 (2.51%) |
599.54 |
595.20 - 617.42 |
1.2115 times |
Thu 20 November 2025 |
596.56 (-1.46%) |
613.39 |
594.54 - 622.65 |
0.7635 times |
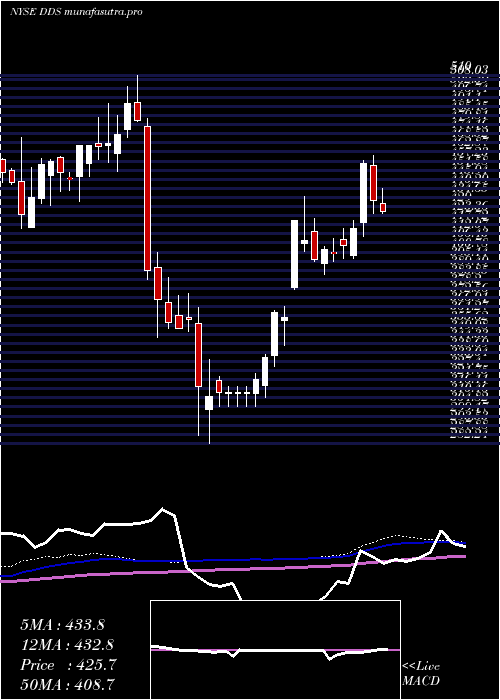
Weekly price and charts DillardS Strong weekly Stock price targets for DillardS DDS are 677.65 and 742.53 | Weekly Target 1 | 627.55 | | Weekly Target 2 | 662.87 | | Weekly Target 3 | 692.43333333333 | | Weekly Target 4 | 727.75 | | Weekly Target 5 | 757.31 |
Weekly price and volumes for Dillard S
| Date |
Closing |
Open |
Range |
Volume |
Fri 05 December 2025 |
698.18 (4.2%) |
660.63 |
657.12 - 722.00 |
1.3341 times |
Fri 28 November 2025 |
670.06 (9.57%) |
608.62 |
602.99 - 679.80 |
1.1214 times |
Fri 21 November 2025 |
611.56 (-3.67%) |
629.98 |
581.50 - 629.98 |
1.2779 times |
Fri 14 November 2025 |
634.89 (4.71%) |
612.77 |
603.09 - 737.73 |
1.7634 times |
Fri 07 November 2025 |
606.36 (1.05%) |
596.39 |
586.77 - 624.00 |
0.8653 times |
Fri 31 October 2025 |
600.08 (0%) |
599.15 |
588.33 - 604.23 |
0.306 times |
Fri 31 October 2025 |
600.08 (-1.02%) |
602.74 |
588.33 - 625.00 |
1.3087 times |
Fri 24 October 2025 |
606.24 (2.06%) |
601.32 |
589.15 - 616.96 |
0.6611 times |
Fri 17 October 2025 |
594.03 (-2.96%) |
596.85 |
587.66 - 634.56 |
1.0272 times |
Tue 07 October 2025 |
612.16 (0.35%) |
618.36 |
605.59 - 620.44 |
0.3349 times |
Fri 03 October 2025 |
610.00 (-2.21%) |
621.66 |
604.13 - 637.73 |
0.7774 times |
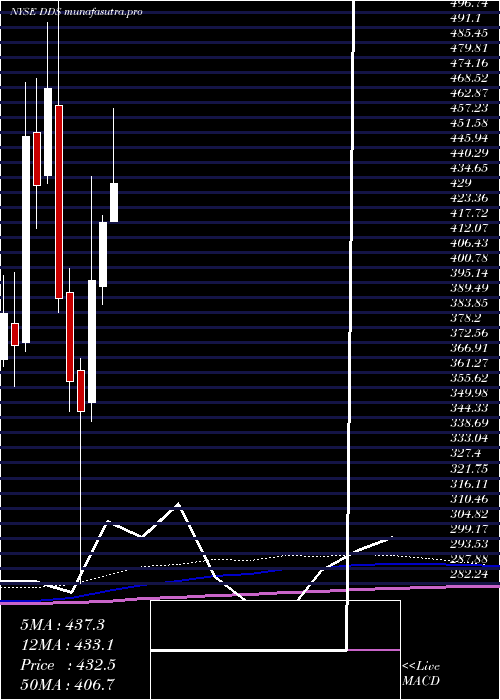
Monthly price and charts DillardS Strong monthly Stock price targets for DillardS DDS are 677.65 and 742.53 | Monthly Target 1 | 627.55 | | Monthly Target 2 | 662.87 | | Monthly Target 3 | 692.43333333333 | | Monthly Target 4 | 727.75 | | Monthly Target 5 | 757.31 |
Monthly price and volumes Dillard S
| Date |
Closing |
Open |
Range |
Volume |
Fri 05 December 2025 |
698.18 (4.2%) |
660.63 |
657.12 - 722.00 |
0.2453 times |
Fri 28 November 2025 |
670.06 (11.66%) |
596.39 |
581.50 - 737.73 |
0.9245 times |
Fri 31 October 2025 |
600.08 (-2.34%) |
618.78 |
587.66 - 637.73 |
0.731 times |
Tue 30 September 2025 |
614.48 (15.31%) |
529.00 |
519.06 - 629.27 |
1.0159 times |
Fri 29 August 2025 |
532.88 (14.12%) |
465.57 |
449.64 - 553.18 |
1.1791 times |
Thu 31 July 2025 |
466.93 (11.75%) |
418.11 |
418.11 - 514.39 |
1.1126 times |
Mon 30 June 2025 |
417.83 (5.51%) |
393.57 |
386.85 - 420.52 |
0.9292 times |
Fri 30 May 2025 |
396.02 (14.24%) |
350.16 |
343.12 - 435.17 |
1.1464 times |
Wed 30 April 2025 |
346.66 (-3.2%) |
362.03 |
282.24 - 366.66 |
1.2604 times |
Mon 31 March 2025 |
358.13 (-7.96%) |
391.30 |
346.74 - 400.47 |
1.4557 times |
Fri 28 February 2025 |
389.09 (-16.88%) |
461.62 |
384.00 - 510.00 |
1.0438 times |
DMA SMA EMA moving averages of Dillard S DDS
DMA (daily moving average) of Dillard S DDS
| DMA period | DMA value | | 5 day DMA | 685.15 | | 12 day DMA | 655.14 | | 20 day DMA | 639.35 | | 35 day DMA | 623.61 | | 50 day DMA | 620.68 | | 100 day DMA | 569.3 | | 150 day DMA | 513.61 | | 200 day DMA | 476.04 | EMA (exponential moving average) of Dillard S DDS
| EMA period | EMA current | EMA prev | EMA prev2 | | 5 day EMA | 683.42 | 676.04 | 673.53 | | 12 day EMA | 663.41 | 657.09 | 652.73 | | 20 day EMA | 648.99 | 643.81 | 639.89 | | 35 day EMA | 635.25 | 631.55 | 628.63 | | 50 day EMA | 624.83 | 621.84 | 619.42 |
SMA (simple moving average) of Dillard S DDS
| SMA period | SMA current | SMA prev | SMA prev2 | | 5 day SMA | 685.15 | 679.52 | 677.59 | | 12 day SMA | 655.14 | 646.88 | 639.77 | | 20 day SMA | 639.35 | 634.49 | 631.17 | | 35 day SMA | 623.61 | 620.7 | 618.4 | | 50 day SMA | 620.68 | 618.19 | 616.54 | | 100 day SMA | 569.3 | 566.64 | 564.2 | | 150 day SMA | 513.61 | 511.23 | 508.92 | | 200 day SMA | 476.04 | 475.01 | 474.1 |
|
|
