EI DD full analysis,charts,indicators,moving averages,SMA,DMA,EMA,ADX,MACD,RSIE I DD WideScreen charts, DMA,SMA,EMA technical analysis, forecast prediction, by indicators ADX,MACD,RSI,CCI NYSE stock exchange
Daily price and charts and targets EI Strong Daily Stock price targets for EI DD are 78.62 and 81.2 | Daily Target 1 | 76.54 | | Daily Target 2 | 78.12 | | Daily Target 3 | 79.12 | | Daily Target 4 | 80.7 | | Daily Target 5 | 81.7 |
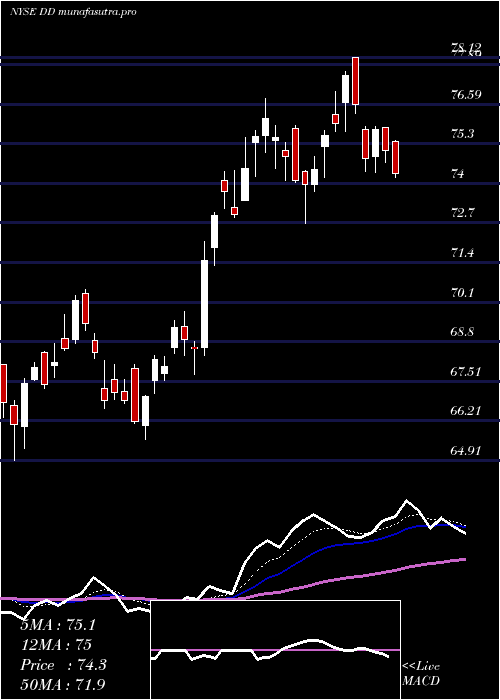
Daily price and volume E I
| Date |
Closing |
Open |
Range |
Volume |
Fri 17 October 2025 |
79.70 (2.05%) |
77.54 |
77.54 - 80.12 |
0.9829 times |
Thu 16 October 2025 |
78.10 (-0.55%) |
79.17 |
77.55 - 79.87 |
0.9185 times |
Wed 15 October 2025 |
78.53 (1.22%) |
78.27 |
77.86 - 79.65 |
1.1554 times |
Tue 14 October 2025 |
77.58 (2.15%) |
74.73 |
74.65 - 77.84 |
0.9956 times |
Mon 13 October 2025 |
75.95 (3.05%) |
74.74 |
74.74 - 76.88 |
1.0145 times |
Fri 10 October 2025 |
73.70 (-5.32%) |
78.12 |
73.68 - 78.87 |
1.5584 times |
Thu 09 October 2025 |
77.84 (-0.68%) |
78.73 |
77.51 - 79.30 |
0.8768 times |
Wed 08 October 2025 |
78.37 (-0.65%) |
79.08 |
78.26 - 79.52 |
0.6938 times |
Tue 07 October 2025 |
78.88 (-2.94%) |
80.95 |
78.49 - 81.25 |
0.9447 times |
Mon 06 October 2025 |
81.27 (1.94%) |
80.50 |
79.95 - 81.97 |
0.8594 times |
Fri 03 October 2025 |
79.72 (-1.56%) |
81.18 |
79.67 - 81.79 |
1.4413 times |
Weekly price and charts EI Strong weekly Stock price targets for EI DD are 77.18 and 82.65 | Weekly Target 1 | 72.69 | | Weekly Target 2 | 76.19 | | Weekly Target 3 | 78.156666666667 | | Weekly Target 4 | 81.66 | | Weekly Target 5 | 83.63 |
Weekly price and volumes for E I
| Date |
Closing |
Open |
Range |
Volume |
Fri 17 October 2025 |
79.70 (8.14%) |
74.74 |
74.65 - 80.12 |
1.0799 times |
Fri 10 October 2025 |
73.70 (-7.55%) |
80.50 |
73.68 - 81.97 |
1.0514 times |
Fri 03 October 2025 |
79.72 (4.65%) |
76.94 |
76.03 - 81.79 |
1.2794 times |
Fri 26 September 2025 |
76.18 (-2.46%) |
77.92 |
74.26 - 79.42 |
1.3919 times |
Fri 19 September 2025 |
78.10 (1.05%) |
77.81 |
76.17 - 78.88 |
1.4952 times |
Fri 12 September 2025 |
77.29 (-0.68%) |
77.56 |
75.88 - 78.84 |
0.8519 times |
Fri 05 September 2025 |
77.82 (1.17%) |
75.81 |
74.87 - 78.53 |
0.8831 times |
Fri 29 August 2025 |
76.92 (0%) |
77.36 |
76.91 - 78.02 |
0.207 times |
Fri 29 August 2025 |
76.92 (-0.52%) |
77.00 |
76.61 - 78.35 |
0.8958 times |
Fri 22 August 2025 |
77.32 (5.8%) |
73.13 |
72.80 - 77.52 |
0.8646 times |
Fri 15 August 2025 |
73.08 (3.7%) |
70.68 |
69.52 - 74.36 |
1.0434 times |

Monthly price and charts EI Strong monthly Stock price targets for EI DD are 76.69 and 84.98 | Monthly Target 1 | 70.16 | | Monthly Target 2 | 74.93 | | Monthly Target 3 | 78.45 | | Monthly Target 4 | 83.22 | | Monthly Target 5 | 86.74 |
Monthly price and volumes E I
| Date |
Closing |
Open |
Range |
Volume |
Fri 17 October 2025 |
79.70 (2.31%) |
77.47 |
73.68 - 81.97 |
0.6481 times |
Tue 30 September 2025 |
77.90 (1.27%) |
75.81 |
74.26 - 79.42 |
1.1469 times |
Fri 29 August 2025 |
76.92 (6.98%) |
70.49 |
68.98 - 78.35 |
1.0938 times |
Thu 31 July 2025 |
71.90 (4.83%) |
68.63 |
68.35 - 78.12 |
1.0009 times |
Mon 30 June 2025 |
68.59 (2.68%) |
66.72 |
64.91 - 70.50 |
0.8257 times |
Fri 30 May 2025 |
66.80 (1.23%) |
66.00 |
64.09 - 72.61 |
1.1372 times |
Wed 30 April 2025 |
65.99 (-11.64%) |
74.57 |
53.77 - 75.89 |
1.4934 times |
Mon 31 March 2025 |
74.68 (-8.67%) |
82.15 |
72.88 - 82.40 |
0.8419 times |
Fri 28 February 2025 |
81.77 (6.47%) |
75.37 |
74.22 - 85.00 |
0.9217 times |
Fri 31 January 2025 |
76.80 (0.72%) |
76.65 |
72.40 - 78.72 |
0.8905 times |
Tue 31 December 2024 |
76.25 (-9.05%) |
84.00 |
75.46 - 85.12 |
0.5239 times |

DMA SMA EMA moving averages of E I DD
DMA (daily moving average) of E I DD
| DMA period | DMA value | | 5 day DMA | 77.97 | | 12 day DMA | 78.39 | | 20 day DMA | 77.8 | | 35 day DMA | 77.5 | | 50 day DMA | 76.7 | | 100 day DMA | 73.93 | | 150 day DMA | 71.52 | | 200 day DMA | 73.15 | EMA (exponential moving average) of E I DD
| EMA period | EMA current | EMA prev | EMA prev2 | | 5 day EMA | 78.36 | 77.69 | 77.49 | | 12 day EMA | 78 | 77.69 | 77.62 | | 20 day EMA | 77.77 | 77.57 | 77.51 | | 35 day EMA | 77.06 | 76.9 | 76.83 | | 50 day EMA | 76.37 | 76.23 | 76.15 |
SMA (simple moving average) of E I DD
| SMA period | SMA current | SMA prev | SMA prev2 | | 5 day SMA | 77.97 | 76.77 | 76.72 | | 12 day SMA | 78.39 | 78.26 | 78.25 | | 20 day SMA | 77.8 | 77.72 | 77.72 | | 35 day SMA | 77.5 | 77.42 | 77.41 | | 50 day SMA | 76.7 | 76.51 | 76.37 | | 100 day SMA | 73.93 | 73.81 | 73.71 | | 150 day SMA | 71.52 | 71.5 | 71.48 | | 200 day SMA | 73.15 | 73.12 | 73.12 |
|
|
