DoublelineOpportunistic DBL full analysis,charts,indicators,moving averages,SMA,DMA,EMA,ADX,MACD,RSIDoubleline Opportunistic DBL WideScreen charts, DMA,SMA,EMA technical analysis, forecast prediction, by indicators ADX,MACD,RSI,CCI NYSE stock exchange
operates under N A sector & deals in N A
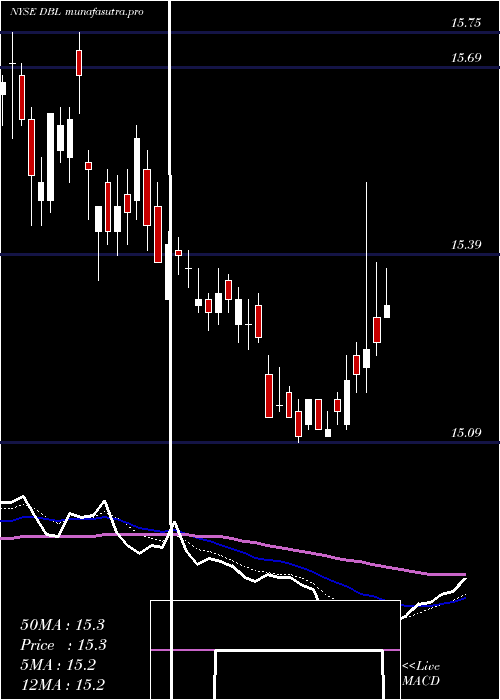
Daily price and charts and targets DoublelineOpportunistic Strong Daily Stock price targets for DoublelineOpportunistic DBL are 15.25 and 15.46 | Daily Target 1 | 15.21 | | Daily Target 2 | 15.29 | | Daily Target 3 | 15.416666666667 | | Daily Target 4 | 15.5 | | Daily Target 5 | 15.63 |
Daily price and volume Doubleline Opportunistic
| Date |
Closing |
Open |
Range |
Volume |
Mon 20 October 2025 |
15.38 (-0.32%) |
15.43 |
15.33 - 15.54 |
4.7155 times |
Fri 17 October 2025 |
15.43 (-0.06%) |
15.44 |
15.33 - 15.45 |
0.6468 times |
Thu 16 October 2025 |
15.44 (-0.9%) |
15.57 |
15.43 - 15.57 |
0.6105 times |
Wed 15 October 2025 |
15.58 (-0.83%) |
15.52 |
15.46 - 15.68 |
0.6685 times |
Tue 14 October 2025 |
15.71 (0.71%) |
15.65 |
15.52 - 15.75 |
1.0636 times |
Mon 13 October 2025 |
15.60 (0.32%) |
15.55 |
15.51 - 15.73 |
0.4099 times |
Fri 10 October 2025 |
15.55 (-0.26%) |
15.60 |
15.51 - 15.64 |
0.3848 times |
Thu 09 October 2025 |
15.59 (-0.06%) |
15.64 |
15.55 - 15.64 |
0.7593 times |
Wed 08 October 2025 |
15.60 (0.78%) |
15.58 |
15.43 - 15.66 |
0.4523 times |
Tue 07 October 2025 |
15.48 (0.19%) |
15.45 |
15.44 - 15.59 |
0.2888 times |
Mon 06 October 2025 |
15.45 (-0.19%) |
15.44 |
15.43 - 15.49 |
0.1954 times |
Weekly price and charts DoublelineOpportunistic Strong weekly Stock price targets for DoublelineOpportunistic DBL are 15.25 and 15.46 | Weekly Target 1 | 15.21 | | Weekly Target 2 | 15.29 | | Weekly Target 3 | 15.416666666667 | | Weekly Target 4 | 15.5 | | Weekly Target 5 | 15.63 |
Weekly price and volumes for Doubleline Opportunistic
| Date |
Closing |
Open |
Range |
Volume |
Mon 20 October 2025 |
15.38 (-0.32%) |
15.43 |
15.33 - 15.54 |
1.6215 times |
Fri 17 October 2025 |
15.43 (-0.77%) |
15.55 |
15.33 - 15.75 |
1.1689 times |
Fri 10 October 2025 |
15.55 (0.45%) |
15.44 |
15.43 - 15.66 |
0.7154 times |
Fri 03 October 2025 |
15.48 (0.52%) |
15.40 |
15.39 - 15.64 |
1.043 times |
Fri 26 September 2025 |
15.40 (-0.45%) |
15.47 |
15.31 - 15.60 |
1.1508 times |
Fri 19 September 2025 |
15.47 (-1.46%) |
15.67 |
15.45 - 15.70 |
0.7134 times |
Fri 12 September 2025 |
15.70 (0.38%) |
15.66 |
15.59 - 15.71 |
0.6411 times |
Fri 05 September 2025 |
15.64 (0.39%) |
15.50 |
15.46 - 16.01 |
1.3937 times |
Fri 29 August 2025 |
15.58 (0%) |
15.59 |
15.47 - 15.59 |
0.3839 times |
Fri 29 August 2025 |
15.58 (0.97%) |
15.45 |
15.36 - 15.60 |
1.1683 times |
Fri 22 August 2025 |
15.43 (0.78%) |
15.31 |
15.23 - 15.46 |
1.0384 times |
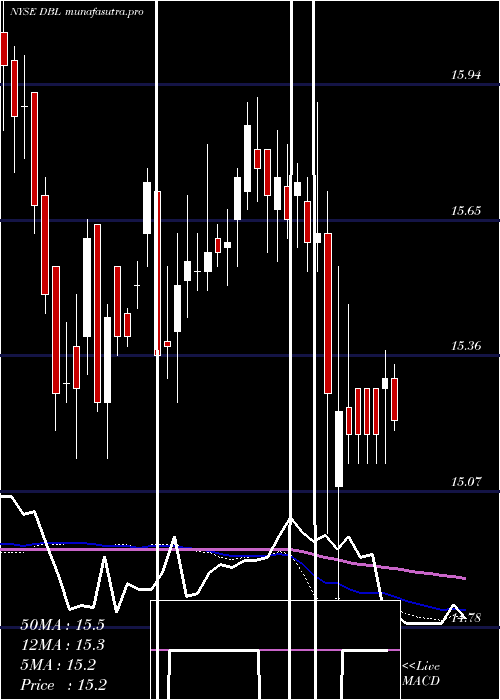
Monthly price and charts DoublelineOpportunistic Strong monthly Stock price targets for DoublelineOpportunistic DBL are 15.15 and 15.57 | Monthly Target 1 | 15.07 | | Monthly Target 2 | 15.22 | | Monthly Target 3 | 15.486666666667 | | Monthly Target 4 | 15.64 | | Monthly Target 5 | 15.91 |
Monthly price and volumes Doubleline Opportunistic
| Date |
Closing |
Open |
Range |
Volume |
Mon 20 October 2025 |
15.38 (-1.28%) |
15.61 |
15.33 - 15.75 |
0.9725 times |
Tue 30 September 2025 |
15.58 (0%) |
15.50 |
15.31 - 16.01 |
1.1054 times |
Fri 29 August 2025 |
15.58 (2.16%) |
15.29 |
15.22 - 15.60 |
1.0401 times |
Thu 31 July 2025 |
15.25 (-0.85%) |
15.32 |
15.09 - 15.51 |
1.5148 times |
Mon 30 June 2025 |
15.38 (-1.66%) |
15.65 |
15.35 - 15.75 |
1.0155 times |
Fri 30 May 2025 |
15.64 (0.64%) |
15.59 |
15.20 - 15.70 |
0.8934 times |
Wed 30 April 2025 |
15.54 (-0.58%) |
15.66 |
14.49 - 15.71 |
1.276 times |
Mon 31 March 2025 |
15.63 (-0.7%) |
15.72 |
15.54 - 15.90 |
0.5814 times |
Fri 28 February 2025 |
15.74 (0%) |
15.71 |
15.56 - 15.91 |
0.667 times |
Fri 31 January 2025 |
15.74 (1.55%) |
15.60 |
15.41 - 15.81 |
0.9338 times |
Tue 31 December 2024 |
15.50 (0.65%) |
15.51 |
15.26 - 15.76 |
0.7701 times |

DMA SMA EMA moving averages of Doubleline Opportunistic DBL
DMA (daily moving average) of Doubleline Opportunistic DBL
| DMA period | DMA value | | 5 day DMA | 15.51 | | 12 day DMA | 15.52 | | 20 day DMA | 15.5 | | 35 day DMA | 15.54 | | 50 day DMA | 15.5 | | 100 day DMA | 15.45 | | 150 day DMA | 15.45 | | 200 day DMA | 15.5 | EMA (exponential moving average) of Doubleline Opportunistic DBL
| EMA period | EMA current | EMA prev | EMA prev2 | | 5 day EMA | 15.47 | 15.51 | 15.55 | | 12 day EMA | 15.5 | 15.52 | 15.54 | | 20 day EMA | 15.52 | 15.53 | 15.54 | | 35 day EMA | 15.5 | 15.51 | 15.52 | | 50 day EMA | 15.5 | 15.5 | 15.5 |
SMA (simple moving average) of Doubleline Opportunistic DBL
| SMA period | SMA current | SMA prev | SMA prev2 | | 5 day SMA | 15.51 | 15.55 | 15.58 | | 12 day SMA | 15.52 | 15.53 | 15.54 | | 20 day SMA | 15.5 | 15.51 | 15.51 | | 35 day SMA | 15.54 | 15.55 | 15.55 | | 50 day SMA | 15.5 | 15.5 | 15.5 | | 100 day SMA | 15.45 | 15.45 | 15.45 | | 150 day SMA | 15.45 | 15.45 | 15.45 | | 200 day SMA | 15.5 | 15.5 | 15.5 |
|
|
