YoudaoInc DAO full analysis,charts,indicators,moving averages,SMA,DMA,EMA,ADX,MACD,RSIYoudao Inc DAO WideScreen charts, DMA,SMA,EMA technical analysis, forecast prediction, by indicators ADX,MACD,RSI,CCI NYSE stock exchange
Daily price and charts and targets YoudaoInc Strong Daily Stock price targets for YoudaoInc DAO are 9.3 and 9.67 | Daily Target 1 | 9.23 | | Daily Target 2 | 9.36 | | Daily Target 3 | 9.5966666666667 | | Daily Target 4 | 9.73 | | Daily Target 5 | 9.97 |
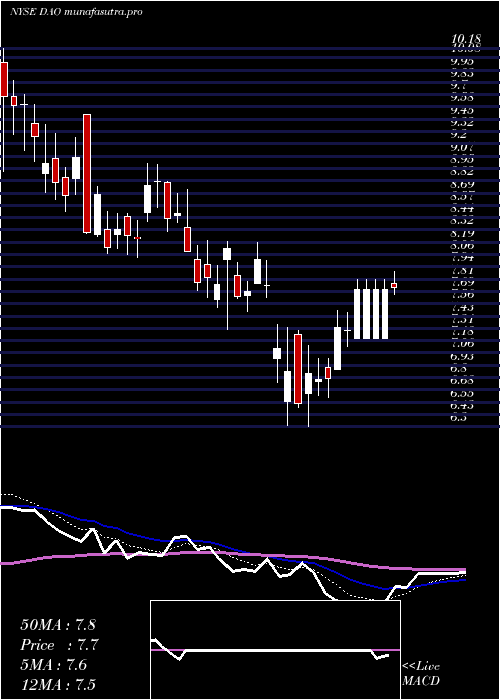
Daily price and volume Youdao Inc
| Date |
Closing |
Open |
Range |
Volume |
Fri 05 December 2025 |
9.50 (-1.35%) |
9.61 |
9.46 - 9.83 |
0.9095 times |
Thu 04 December 2025 |
9.63 (-2.13%) |
9.80 |
9.61 - 9.90 |
0.4537 times |
Wed 03 December 2025 |
9.84 (2.82%) |
9.63 |
9.50 - 9.88 |
0.5989 times |
Tue 02 December 2025 |
9.57 (0.1%) |
9.53 |
9.46 - 9.68 |
0.5846 times |
Mon 01 December 2025 |
9.56 (-5.06%) |
9.97 |
9.38 - 10.04 |
1.0792 times |
Fri 28 November 2025 |
10.07 (10.66%) |
9.19 |
9.15 - 10.16 |
1.5444 times |
Wed 26 November 2025 |
9.10 (-2.99%) |
9.34 |
9.08 - 9.56 |
0.7557 times |
Tue 25 November 2025 |
9.38 (0.64%) |
9.43 |
9.11 - 9.62 |
0.9117 times |
Mon 24 November 2025 |
9.32 (-2.92%) |
9.51 |
9.12 - 9.59 |
1.6473 times |
Fri 21 November 2025 |
9.60 (7.14%) |
9.06 |
8.69 - 9.76 |
1.515 times |
Thu 20 November 2025 |
8.96 (-8.1%) |
9.20 |
8.87 - 9.94 |
1.996 times |
Weekly price and charts YoudaoInc Strong weekly Stock price targets for YoudaoInc DAO are 9.11 and 9.77 | Weekly Target 1 | 8.98 | | Weekly Target 2 | 9.24 | | Weekly Target 3 | 9.64 | | Weekly Target 4 | 9.9 | | Weekly Target 5 | 10.3 |
Weekly price and volumes for Youdao Inc
| Date |
Closing |
Open |
Range |
Volume |
Fri 05 December 2025 |
9.50 (-5.66%) |
9.97 |
9.38 - 10.04 |
0.9483 times |
Fri 28 November 2025 |
10.07 (4.9%) |
9.51 |
9.08 - 10.16 |
1.2709 times |
Fri 21 November 2025 |
9.60 (3.56%) |
9.34 |
8.69 - 9.97 |
1.8307 times |
Fri 14 November 2025 |
9.27 (-11.12%) |
10.58 |
9.25 - 11.00 |
1.079 times |
Fri 07 November 2025 |
10.43 (-0.57%) |
10.56 |
10.09 - 10.98 |
0.6475 times |
Fri 31 October 2025 |
10.49 (0%) |
10.60 |
10.37 - 10.76 |
0.321 times |
Fri 31 October 2025 |
10.49 (-4.38%) |
11.13 |
10.37 - 11.30 |
1.3034 times |
Fri 24 October 2025 |
10.97 (-0.27%) |
10.89 |
10.37 - 11.37 |
1.1494 times |
Fri 17 October 2025 |
11.00 (8.27%) |
10.85 |
10.60 - 11.50 |
1.197 times |
Tue 07 October 2025 |
10.16 (5.72%) |
9.60 |
9.41 - 10.48 |
0.2529 times |
Fri 03 October 2025 |
9.61 (1.48%) |
9.47 |
9.43 - 9.98 |
0.7683 times |

Monthly price and charts YoudaoInc Strong monthly Stock price targets for YoudaoInc DAO are 9.11 and 9.77 | Monthly Target 1 | 8.98 | | Monthly Target 2 | 9.24 | | Monthly Target 3 | 9.64 | | Monthly Target 4 | 9.9 | | Monthly Target 5 | 10.3 |
Monthly price and volumes Youdao Inc
| Date |
Closing |
Open |
Range |
Volume |
Fri 05 December 2025 |
9.50 (-5.66%) |
9.97 |
9.38 - 10.04 |
0.265 times |
Fri 28 November 2025 |
10.07 (-4%) |
10.56 |
8.69 - 11.00 |
1.3489 times |
Fri 31 October 2025 |
10.49 (5.53%) |
9.93 |
9.41 - 11.50 |
1.2364 times |
Tue 30 September 2025 |
9.94 (10.81%) |
8.89 |
8.30 - 9.98 |
0.9593 times |
Fri 29 August 2025 |
8.97 (3.1%) |
8.60 |
8.60 - 10.60 |
1.2373 times |
Thu 31 July 2025 |
8.70 (1.16%) |
8.52 |
8.33 - 8.88 |
0.5511 times |
Mon 30 June 2025 |
8.60 (-7.23%) |
9.18 |
8.00 - 9.20 |
0.5475 times |
Fri 30 May 2025 |
9.27 (4.27%) |
8.90 |
8.49 - 10.00 |
0.9681 times |
Wed 30 April 2025 |
8.89 (16.51%) |
7.64 |
6.30 - 8.89 |
1.195 times |
Mon 31 March 2025 |
7.63 (-15.22%) |
9.05 |
7.30 - 9.50 |
1.6914 times |
Fri 28 February 2025 |
9.00 (11.8%) |
7.68 |
7.02 - 11.82 |
3.1612 times |

DMA SMA EMA moving averages of Youdao Inc DAO
DMA (daily moving average) of Youdao Inc DAO
| DMA period | DMA value | | 5 day DMA | 9.62 | | 12 day DMA | 9.52 | | 20 day DMA | 9.73 | | 35 day DMA | 10.18 | | 50 day DMA | 10.16 | | 100 day DMA | 9.53 | | 150 day DMA | 9.31 | | 200 day DMA | 9.07 | EMA (exponential moving average) of Youdao Inc DAO
| EMA period | EMA current | EMA prev | EMA prev2 | | 5 day EMA | 9.6 | 9.65 | 9.66 | | 12 day EMA | 9.64 | 9.66 | 9.67 | | 20 day EMA | 9.74 | 9.77 | 9.79 | | 35 day EMA | 9.84 | 9.86 | 9.87 | | 50 day EMA | 10 | 10.02 | 10.04 |
SMA (simple moving average) of Youdao Inc DAO
| SMA period | SMA current | SMA prev | SMA prev2 | | 5 day SMA | 9.62 | 9.73 | 9.63 | | 12 day SMA | 9.52 | 9.54 | 9.51 | | 20 day SMA | 9.73 | 9.8 | 9.84 | | 35 day SMA | 10.18 | 10.24 | 10.28 | | 50 day SMA | 10.16 | 10.15 | 10.14 | | 100 day SMA | 9.53 | 9.52 | 9.51 | | 150 day SMA | 9.31 | 9.31 | 9.3 | | 200 day SMA | 9.07 | 9.07 | 9.07 |
|
|
