ColonialInvestment CXH full analysis,charts,indicators,moving averages,SMA,DMA,EMA,ADX,MACD,RSIColonial Investment CXH WideScreen charts, DMA,SMA,EMA technical analysis, forecast prediction, by indicators ADX,MACD,RSI,CCI NYSE stock exchange
operates under N A sector & deals in N A
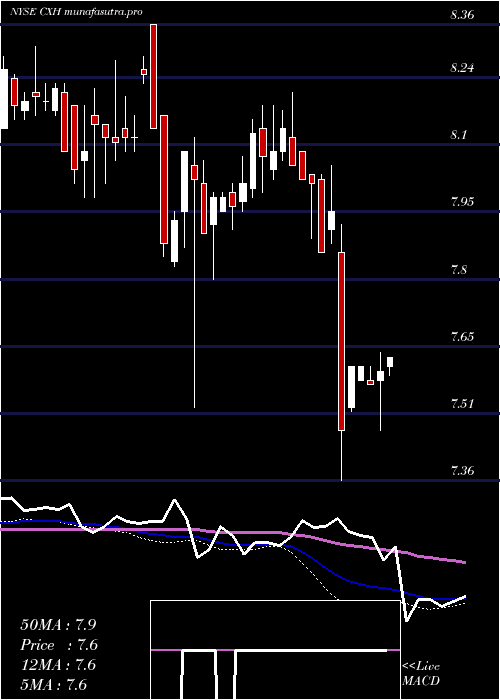
Daily price and charts and targets ColonialInvestment Strong Daily Stock price targets for ColonialInvestment CXH are 7.92 and 7.97 | Daily Target 1 | 7.91 | | Daily Target 2 | 7.92 | | Daily Target 3 | 7.9566666666667 | | Daily Target 4 | 7.97 | | Daily Target 5 | 8.01 |
Daily price and volume Colonial Investment
| Date |
Closing |
Open |
Range |
Volume |
Thu 04 December 2025 |
7.94 (-0.13%) |
7.94 |
7.94 - 7.99 |
0.936 times |
Wed 03 December 2025 |
7.95 (0.13%) |
7.99 |
7.95 - 8.01 |
1.3148 times |
Tue 02 December 2025 |
7.94 (-0.25%) |
7.97 |
7.92 - 7.97 |
0.5573 times |
Mon 01 December 2025 |
7.96 (-0.13%) |
7.98 |
7.93 - 7.98 |
1.7506 times |
Fri 28 November 2025 |
7.97 (0.38%) |
7.96 |
7.96 - 7.97 |
0.2215 times |
Wed 26 November 2025 |
7.94 (-0.25%) |
8.00 |
7.93 - 8.00 |
2.2365 times |
Tue 25 November 2025 |
7.96 (0.25%) |
7.98 |
7.96 - 7.99 |
0.9182 times |
Mon 24 November 2025 |
7.94 (-0.5%) |
7.96 |
7.94 - 7.99 |
1.3683 times |
Fri 21 November 2025 |
7.98 (0.38%) |
7.93 |
7.93 - 7.98 |
0.4359 times |
Thu 20 November 2025 |
7.95 (0%) |
7.95 |
7.93 - 7.97 |
0.2608 times |
Wed 19 November 2025 |
7.95 (0%) |
7.93 |
7.93 - 7.97 |
0.2965 times |

Weekly price and charts ColonialInvestment Strong weekly Stock price targets for ColonialInvestment CXH are 7.89 and 7.98 | Weekly Target 1 | 7.87 | | Weekly Target 2 | 7.9 | | Weekly Target 3 | 7.9566666666667 | | Weekly Target 4 | 7.99 | | Weekly Target 5 | 8.05 |
Weekly price and volumes for Colonial Investment
| Date |
Closing |
Open |
Range |
Volume |
Thu 04 December 2025 |
7.94 (-0.38%) |
7.98 |
7.92 - 8.01 |
1.6621 times |
Fri 28 November 2025 |
7.97 (-0.13%) |
7.96 |
7.93 - 8.00 |
1.7298 times |
Fri 21 November 2025 |
7.98 (-0.13%) |
8.01 |
7.93 - 8.01 |
0.5549 times |
Fri 14 November 2025 |
7.99 (0%) |
7.99 |
7.96 - 8.01 |
1.1906 times |
Fri 07 November 2025 |
7.99 (-0.37%) |
8.02 |
7.94 - 8.02 |
0.7607 times |
Fri 31 October 2025 |
8.02 (0%) |
7.97 |
7.97 - 8.04 |
0.508 times |
Fri 31 October 2025 |
8.02 (0.25%) |
8.03 |
7.96 - 8.04 |
1.4537 times |
Fri 24 October 2025 |
8.00 (0.5%) |
7.95 |
7.95 - 8.03 |
0.7855 times |
Fri 17 October 2025 |
7.96 (1.02%) |
7.94 |
7.90 - 7.96 |
0.8245 times |
Fri 10 October 2025 |
7.88 (0.25%) |
7.83 |
7.82 - 7.92 |
0.5303 times |
Fri 03 October 2025 |
7.86 (0.26%) |
7.85 |
7.82 - 7.89 |
0.8981 times |
Monthly price and charts ColonialInvestment Strong monthly Stock price targets for ColonialInvestment CXH are 7.89 and 7.98 | Monthly Target 1 | 7.87 | | Monthly Target 2 | 7.9 | | Monthly Target 3 | 7.9566666666667 | | Monthly Target 4 | 7.99 | | Monthly Target 5 | 8.05 |
Monthly price and volumes Colonial Investment
| Date |
Closing |
Open |
Range |
Volume |
Thu 04 December 2025 |
7.94 (-0.38%) |
7.98 |
7.92 - 8.01 |
0.3074 times |
Fri 28 November 2025 |
7.97 (-0.62%) |
8.02 |
7.93 - 8.02 |
0.7833 times |
Fri 31 October 2025 |
8.02 (2.04%) |
7.88 |
7.82 - 8.04 |
0.894 times |
Tue 30 September 2025 |
7.86 (5.22%) |
7.48 |
7.45 - 7.92 |
0.9638 times |
Fri 29 August 2025 |
7.47 (0.95%) |
7.42 |
7.42 - 7.56 |
0.8342 times |
Thu 31 July 2025 |
7.40 (-3.14%) |
7.65 |
7.34 - 7.75 |
2.9102 times |
Mon 30 June 2025 |
7.64 (0.79%) |
7.56 |
7.52 - 7.67 |
0.8005 times |
Fri 30 May 2025 |
7.58 (-1.17%) |
7.69 |
7.54 - 7.75 |
1.1377 times |
Wed 30 April 2025 |
7.67 (-3.16%) |
7.90 |
7.36 - 8.05 |
0.9287 times |
Mon 31 March 2025 |
7.92 (-2.58%) |
8.11 |
7.86 - 8.21 |
0.4402 times |
Fri 28 February 2025 |
8.13 (1.5%) |
8.00 |
7.98 - 8.18 |
0.5772 times |

DMA SMA EMA moving averages of Colonial Investment CXH
DMA (daily moving average) of Colonial Investment CXH
| DMA period | DMA value | | 5 day DMA | 7.95 | | 12 day DMA | 7.95 | | 20 day DMA | 7.97 | | 35 day DMA | 7.98 | | 50 day DMA | 7.95 | | 100 day DMA | 7.76 | | 150 day DMA | 7.71 | | 200 day DMA | 7.75 | EMA (exponential moving average) of Colonial Investment CXH
| EMA period | EMA current | EMA prev | EMA prev2 | | 5 day EMA | 7.95 | 7.95 | 7.95 | | 12 day EMA | 7.97 | 7.97 | 7.97 | | 20 day EMA | 7.97 | 7.97 | 7.97 | | 35 day EMA | 7.93 | 7.93 | 7.93 | | 50 day EMA | 7.94 | 7.94 | 7.94 |
SMA (simple moving average) of Colonial Investment CXH
| SMA period | SMA current | SMA prev | SMA prev2 | | 5 day SMA | 7.95 | 7.95 | 7.95 | | 12 day SMA | 7.95 | 7.96 | 7.96 | | 20 day SMA | 7.97 | 7.97 | 7.97 | | 35 day SMA | 7.98 | 7.98 | 7.98 | | 50 day SMA | 7.95 | 7.95 | 7.95 | | 100 day SMA | 7.76 | 7.75 | 7.75 | | 150 day SMA | 7.71 | 7.71 | 7.7 | | 200 day SMA | 7.75 | 7.75 | 7.75 |
|
|
