ColonialHigh CXE full analysis,charts,indicators,moving averages,SMA,DMA,EMA,ADX,MACD,RSIColonial High CXE WideScreen charts, DMA,SMA,EMA technical analysis, forecast prediction, by indicators ADX,MACD,RSI,CCI NYSE stock exchange
operates under N A sector & deals in N A
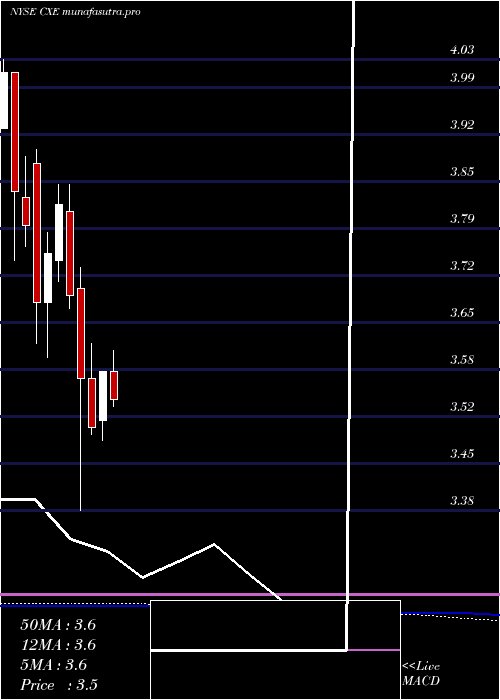
Daily price and charts and targets ColonialHigh Strong Daily Stock price targets for ColonialHigh CXE are 3.72 and 3.78 | Daily Target 1 | 3.67 | | Daily Target 2 | 3.7 | | Daily Target 3 | 3.7266666666667 | | Daily Target 4 | 3.76 | | Daily Target 5 | 3.79 |
Daily price and volume Colonial High
| Date |
Closing |
Open |
Range |
Volume |
Thu 04 December 2025 |
3.74 (0.54%) |
3.70 |
3.69 - 3.75 |
1.8377 times |
Wed 03 December 2025 |
3.72 (1.36%) |
3.69 |
3.67 - 3.72 |
0.955 times |
Tue 02 December 2025 |
3.67 (0%) |
3.65 |
3.65 - 3.69 |
1.1817 times |
Mon 01 December 2025 |
3.67 (-1.08%) |
3.69 |
3.67 - 3.71 |
0.6136 times |
Fri 28 November 2025 |
3.71 (0.82%) |
3.72 |
3.69 - 3.72 |
1.0938 times |
Wed 26 November 2025 |
3.68 (0%) |
3.66 |
3.66 - 3.70 |
0.8545 times |
Tue 25 November 2025 |
3.68 (0.55%) |
3.66 |
3.65 - 3.68 |
1.0915 times |
Mon 24 November 2025 |
3.66 (0%) |
3.65 |
3.65 - 3.68 |
1.3842 times |
Fri 21 November 2025 |
3.66 (-0.81%) |
3.66 |
3.65 - 3.69 |
0.521 times |
Thu 20 November 2025 |
3.69 (-0.54%) |
3.73 |
3.68 - 3.73 |
0.4669 times |
Wed 19 November 2025 |
3.71 (-0.54%) |
3.71 |
3.71 - 3.73 |
0.4896 times |
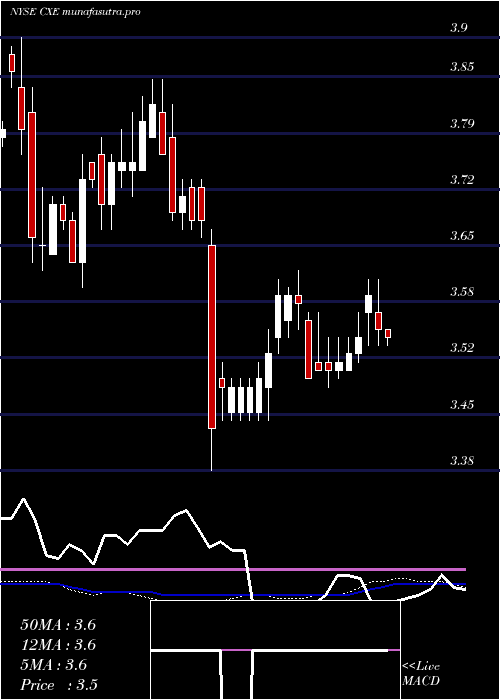
Weekly price and charts ColonialHigh Strong weekly Stock price targets for ColonialHigh CXE are 3.7 and 3.8 | Weekly Target 1 | 3.61 | | Weekly Target 2 | 3.68 | | Weekly Target 3 | 3.7133333333333 | | Weekly Target 4 | 3.78 | | Weekly Target 5 | 3.81 |
Weekly price and volumes for Colonial High
| Date |
Closing |
Open |
Range |
Volume |
Thu 04 December 2025 |
3.74 (0.81%) |
3.69 |
3.65 - 3.75 |
1.4331 times |
Fri 28 November 2025 |
3.71 (1.37%) |
3.65 |
3.65 - 3.72 |
1.3819 times |
Fri 21 November 2025 |
3.66 (-2.4%) |
3.75 |
3.65 - 3.79 |
0.9463 times |
Fri 14 November 2025 |
3.75 (0.54%) |
3.73 |
3.71 - 3.80 |
1.0434 times |
Fri 07 November 2025 |
3.73 (0%) |
3.73 |
3.68 - 3.75 |
1.4914 times |
Fri 31 October 2025 |
3.73 (0%) |
3.78 |
3.73 - 3.78 |
0.2365 times |
Fri 31 October 2025 |
3.73 (-0.27%) |
3.76 |
3.71 - 3.78 |
1.287 times |
Fri 24 October 2025 |
3.74 (1.63%) |
3.68 |
3.67 - 3.80 |
0.8427 times |
Fri 17 October 2025 |
3.68 (-1.6%) |
3.74 |
3.68 - 3.76 |
0.6431 times |
Fri 10 October 2025 |
3.74 (0.81%) |
3.68 |
3.67 - 3.75 |
0.6944 times |
Fri 03 October 2025 |
3.71 (0%) |
3.70 |
3.67 - 3.74 |
1.0431 times |
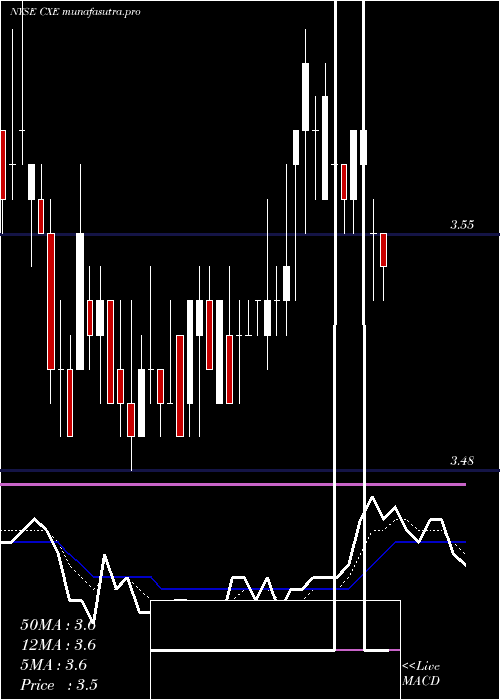
Monthly price and charts ColonialHigh Strong monthly Stock price targets for ColonialHigh CXE are 3.7 and 3.8 | Monthly Target 1 | 3.61 | | Monthly Target 2 | 3.68 | | Monthly Target 3 | 3.7133333333333 | | Monthly Target 4 | 3.78 | | Monthly Target 5 | 3.81 |
Monthly price and volumes Colonial High
| Date |
Closing |
Open |
Range |
Volume |
Thu 04 December 2025 |
3.74 (0.81%) |
3.69 |
3.65 - 3.75 |
0.3702 times |
Fri 28 November 2025 |
3.71 (-0.54%) |
3.73 |
3.65 - 3.80 |
1.2561 times |
Fri 31 October 2025 |
3.73 (0.27%) |
3.72 |
3.67 - 3.80 |
1.0934 times |
Tue 30 September 2025 |
3.72 (4.79%) |
3.54 |
3.52 - 3.75 |
1.1788 times |
Fri 29 August 2025 |
3.55 (0%) |
3.55 |
3.40 - 3.63 |
0.8224 times |
Thu 31 July 2025 |
3.55 (-0.84%) |
3.58 |
3.45 - 3.61 |
1.2623 times |
Mon 30 June 2025 |
3.58 (2.29%) |
3.51 |
3.48 - 3.58 |
0.952 times |
Fri 30 May 2025 |
3.50 (-1.96%) |
3.57 |
3.49 - 3.62 |
1.1216 times |
Wed 30 April 2025 |
3.57 (-3.25%) |
3.70 |
3.38 - 3.73 |
1.1394 times |
Mon 31 March 2025 |
3.69 (-3.4%) |
3.81 |
3.67 - 3.85 |
0.8038 times |
Fri 28 February 2025 |
3.82 (1.87%) |
3.74 |
3.71 - 3.85 |
1.123 times |
DMA SMA EMA moving averages of Colonial High CXE
DMA (daily moving average) of Colonial High CXE
| DMA period | DMA value | | 5 day DMA | 3.7 | | 12 day DMA | 3.69 | | 20 day DMA | 3.71 | | 35 day DMA | 3.72 | | 50 day DMA | 3.72 | | 100 day DMA | 3.65 | | 150 day DMA | 3.61 | | 200 day DMA | 3.62 | EMA (exponential moving average) of Colonial High CXE
| EMA period | EMA current | EMA prev | EMA prev2 | | 5 day EMA | 3.71 | 3.69 | 3.68 | | 12 day EMA | 3.71 | 3.7 | 3.7 | | 20 day EMA | 3.71 | 3.71 | 3.71 | | 35 day EMA | 3.72 | 3.72 | 3.72 | | 50 day EMA | 3.72 | 3.72 | 3.72 |
SMA (simple moving average) of Colonial High CXE
| SMA period | SMA current | SMA prev | SMA prev2 | | 5 day SMA | 3.7 | 3.69 | 3.68 | | 12 day SMA | 3.69 | 3.69 | 3.7 | | 20 day SMA | 3.71 | 3.71 | 3.71 | | 35 day SMA | 3.72 | 3.72 | 3.72 | | 50 day SMA | 3.72 | 3.71 | 3.71 | | 100 day SMA | 3.65 | 3.64 | 3.64 | | 150 day SMA | 3.61 | 3.61 | 3.61 | | 200 day SMA | 3.62 | 3.62 | 3.62 |
|
|
