CushmanWakefield CWK full analysis,charts,indicators,moving averages,SMA,DMA,EMA,ADX,MACD,RSICushman Wakefield CWK WideScreen charts, DMA,SMA,EMA technical analysis, forecast prediction, by indicators ADX,MACD,RSI,CCI NYSE stock exchange
operates under Finance sector & deals in Real Estate
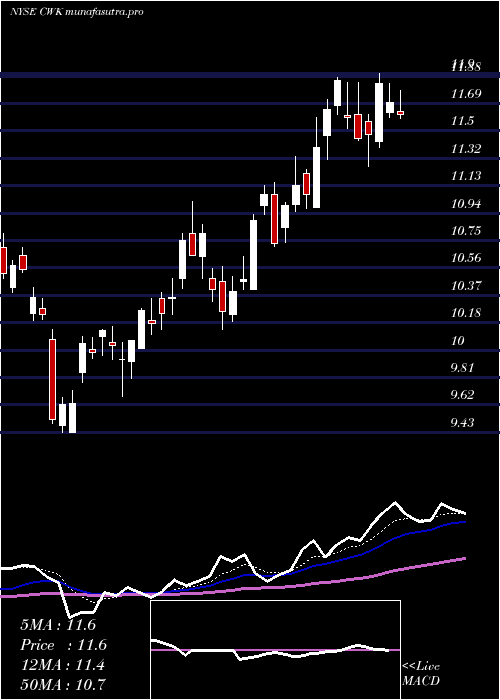
Daily price and charts and targets CushmanWakefield Strong Daily Stock price targets for CushmanWakefield CWK are 15.97 and 16.36 | Daily Target 1 | 15.65 | | Daily Target 2 | 15.9 | | Daily Target 3 | 16.043333333333 | | Daily Target 4 | 16.29 | | Daily Target 5 | 16.43 |
Daily price and volume Cushman Wakefield
| Date |
Closing |
Open |
Range |
Volume |
Mon 20 October 2025 |
16.14 (2.41%) |
15.92 |
15.80 - 16.19 |
0.6039 times |
Fri 17 October 2025 |
15.76 (-0.13%) |
15.58 |
15.54 - 15.81 |
0.7506 times |
Thu 16 October 2025 |
15.78 (-0.82%) |
15.89 |
15.67 - 15.95 |
0.7548 times |
Wed 15 October 2025 |
15.91 (2.32%) |
15.74 |
15.70 - 16.03 |
1.0325 times |
Tue 14 October 2025 |
15.55 (3.39%) |
14.87 |
14.87 - 15.71 |
1.2743 times |
Mon 13 October 2025 |
15.04 (2.94%) |
14.77 |
14.53 - 15.06 |
1.187 times |
Fri 10 October 2025 |
14.61 (-1.75%) |
15.09 |
14.55 - 15.15 |
0.9305 times |
Thu 09 October 2025 |
14.87 (0.07%) |
14.78 |
14.64 - 15.00 |
0.9625 times |
Wed 08 October 2025 |
14.86 (-2.11%) |
15.14 |
14.79 - 15.14 |
1.1727 times |
Tue 07 October 2025 |
15.18 (-2.57%) |
15.55 |
15.15 - 15.61 |
1.3312 times |
Mon 06 October 2025 |
15.58 (-1.7%) |
15.89 |
15.23 - 15.95 |
1.0539 times |
Weekly price and charts CushmanWakefield Strong weekly Stock price targets for CushmanWakefield CWK are 15.97 and 16.36 | Weekly Target 1 | 15.65 | | Weekly Target 2 | 15.9 | | Weekly Target 3 | 16.043333333333 | | Weekly Target 4 | 16.29 | | Weekly Target 5 | 16.43 |
Weekly price and volumes for Cushman Wakefield
| Date |
Closing |
Open |
Range |
Volume |
Mon 20 October 2025 |
16.14 (2.41%) |
15.92 |
15.80 - 16.19 |
0.1053 times |
Fri 17 October 2025 |
15.76 (7.87%) |
14.77 |
14.53 - 16.03 |
0.8719 times |
Fri 10 October 2025 |
14.61 (-7.82%) |
15.89 |
14.55 - 15.95 |
0.9507 times |
Fri 03 October 2025 |
15.85 (-0.13%) |
16.00 |
15.58 - 16.14 |
0.9215 times |
Fri 26 September 2025 |
15.87 (-4.63%) |
16.64 |
15.55 - 16.90 |
1.6935 times |
Fri 19 September 2025 |
16.64 (0%) |
16.61 |
16.38 - 17.04 |
1.5388 times |
Fri 12 September 2025 |
16.64 (0.3%) |
16.39 |
15.88 - 16.76 |
0.9263 times |
Fri 05 September 2025 |
16.59 (5.2%) |
15.31 |
15.21 - 16.60 |
1.3284 times |
Fri 29 August 2025 |
15.77 (0%) |
15.87 |
15.61 - 15.90 |
0.1853 times |
Fri 29 August 2025 |
15.77 (1.22%) |
15.50 |
15.32 - 16.22 |
1.4783 times |
Fri 22 August 2025 |
15.58 (5.41%) |
14.84 |
14.45 - 15.74 |
1.3527 times |
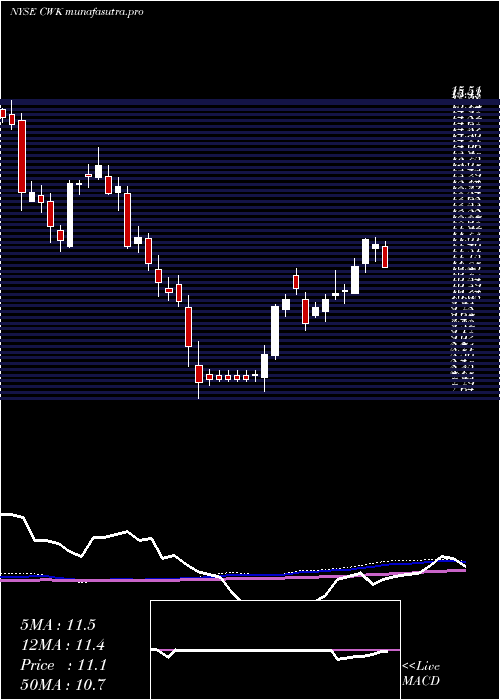
Monthly price and charts CushmanWakefield Strong monthly Stock price targets for CushmanWakefield CWK are 15.34 and 17 | Monthly Target 1 | 13.96 | | Monthly Target 2 | 15.05 | | Monthly Target 3 | 15.62 | | Monthly Target 4 | 16.71 | | Monthly Target 5 | 17.28 |
Monthly price and volumes Cushman Wakefield
| Date |
Closing |
Open |
Range |
Volume |
Mon 20 October 2025 |
16.14 (1.38%) |
15.88 |
14.53 - 16.19 |
0.4696 times |
Tue 30 September 2025 |
15.92 (0.95%) |
15.31 |
15.21 - 17.04 |
1.1385 times |
Fri 29 August 2025 |
15.77 (29.37%) |
11.81 |
11.59 - 16.22 |
1.3102 times |
Thu 31 July 2025 |
12.19 (10.12%) |
10.98 |
10.94 - 12.68 |
1.1578 times |
Mon 30 June 2025 |
11.07 (10.37%) |
9.93 |
9.68 - 11.33 |
0.8828 times |
Fri 30 May 2025 |
10.03 (7.04%) |
9.48 |
9.41 - 11.08 |
0.9108 times |
Wed 30 April 2025 |
9.37 (-8.32%) |
10.16 |
7.64 - 10.37 |
1.5245 times |
Mon 31 March 2025 |
10.22 (-14.05%) |
11.87 |
9.94 - 12.00 |
0.9614 times |
Fri 28 February 2025 |
11.89 (-13.78%) |
13.49 |
11.49 - 13.78 |
0.9036 times |
Fri 31 January 2025 |
13.79 (5.43%) |
13.10 |
11.53 - 14.28 |
0.7407 times |
Tue 31 December 2024 |
13.08 (-14.12%) |
15.28 |
12.60 - 15.51 |
0.5909 times |
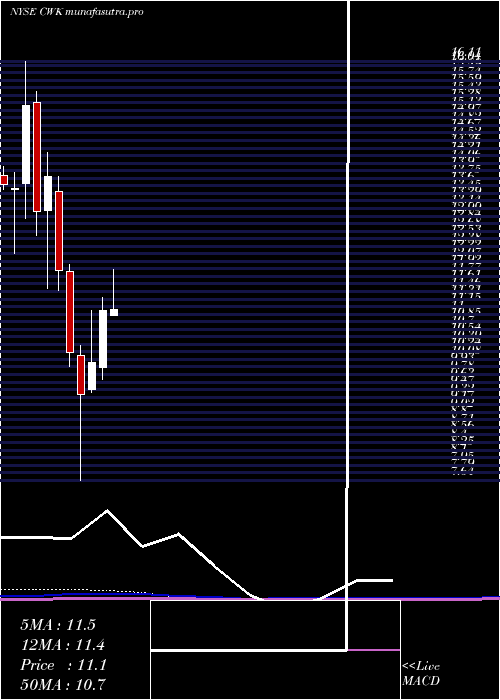
DMA SMA EMA moving averages of Cushman Wakefield CWK
DMA (daily moving average) of Cushman Wakefield CWK
| DMA period | DMA value | | 5 day DMA | 15.83 | | 12 day DMA | 15.43 | | 20 day DMA | 15.62 | | 35 day DMA | 15.92 | | 50 day DMA | 15.73 | | 100 day DMA | 13.53 | | 150 day DMA | 12.17 | | 200 day DMA | 12.24 | EMA (exponential moving average) of Cushman Wakefield CWK
| EMA period | EMA current | EMA prev | EMA prev2 | | 5 day EMA | 15.79 | 15.62 | 15.55 | | 12 day EMA | 15.64 | 15.55 | 15.51 | | 20 day EMA | 15.66 | 15.61 | 15.59 | | 35 day EMA | 15.55 | 15.52 | 15.51 | | 50 day EMA | 15.56 | 15.54 | 15.53 |
SMA (simple moving average) of Cushman Wakefield CWK
| SMA period | SMA current | SMA prev | SMA prev2 | | 5 day SMA | 15.83 | 15.61 | 15.38 | | 12 day SMA | 15.43 | 15.39 | 15.41 | | 20 day SMA | 15.62 | 15.64 | 15.68 | | 35 day SMA | 15.92 | 15.91 | 15.91 | | 50 day SMA | 15.73 | 15.68 | 15.63 | | 100 day SMA | 13.53 | 13.47 | 13.41 | | 150 day SMA | 12.17 | 12.13 | 12.1 | | 200 day SMA | 12.24 | 12.22 | 12.21 |
|
|
