ChevronCorporation CVX full analysis,charts,indicators,moving averages,SMA,DMA,EMA,ADX,MACD,RSIChevron Corporation CVX WideScreen charts, DMA,SMA,EMA technical analysis, forecast prediction, by indicators ADX,MACD,RSI,CCI NYSE stock exchange
operates under Energy sector & deals in Integrated Oil Companies
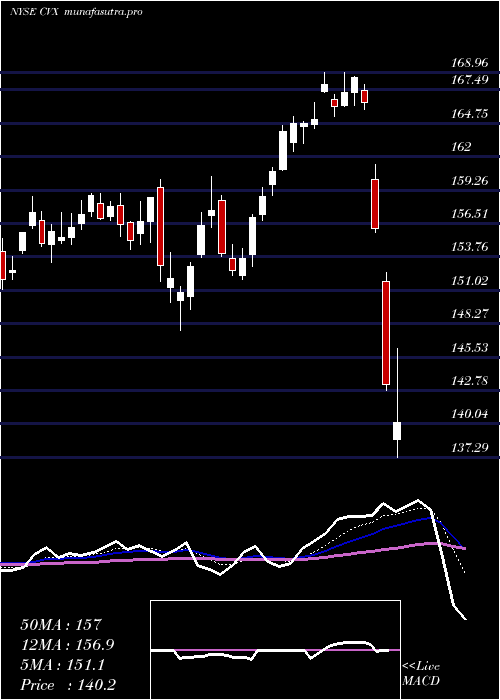
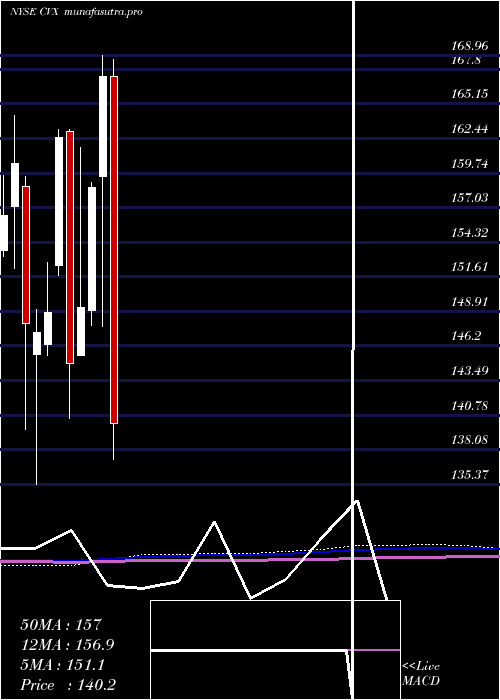
Daily price and charts and targets ChevronCorporation Strong Daily Stock price targets for ChevronCorporation CVX are 148.49 and 151.29 | Daily Target 1 | 148 | | Daily Target 2 | 148.98 | | Daily Target 3 | 150.80333333333 | | Daily Target 4 | 151.78 | | Daily Target 5 | 153.6 |
Daily price and volume Chevron Corporation
| Date |
Closing |
Open |
Range |
Volume |
Fri 05 December 2025 |
149.95 (-1.52%) |
152.02 |
149.83 - 152.63 |
0.9141 times |
Thu 04 December 2025 |
152.26 (0.44%) |
151.75 |
151.22 - 152.94 |
1.0716 times |
Wed 03 December 2025 |
151.59 (0.93%) |
151.04 |
150.98 - 152.50 |
1.1906 times |
Tue 02 December 2025 |
150.20 (-1.53%) |
152.87 |
149.26 - 152.97 |
0.6243 times |
Mon 01 December 2025 |
152.54 (0.93%) |
151.75 |
151.50 - 153.95 |
1.2125 times |
Fri 28 November 2025 |
151.13 (1.04%) |
149.46 |
149.26 - 151.52 |
0.5685 times |
Wed 26 November 2025 |
149.58 (0.71%) |
148.80 |
148.20 - 150.46 |
0.3868 times |
Tue 25 November 2025 |
148.52 (-0.82%) |
150.04 |
148.27 - 150.08 |
0.5708 times |
Mon 24 November 2025 |
149.75 (-0.15%) |
149.82 |
147.74 - 150.12 |
2.0947 times |
Fri 21 November 2025 |
149.98 (-0.22%) |
150.43 |
148.75 - 151.01 |
1.3661 times |
Thu 20 November 2025 |
150.31 (-0.92%) |
152.54 |
150.05 - 153.04 |
1.1261 times |
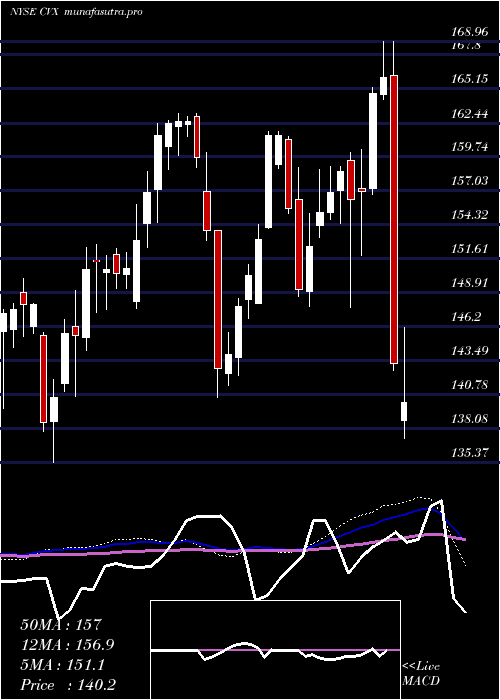
Weekly price and charts ChevronCorporation Strong weekly Stock price targets for ChevronCorporation CVX are 147.26 and 151.95 | Weekly Target 1 | 146.36 | | Weekly Target 2 | 148.16 | | Weekly Target 3 | 151.05333333333 | | Weekly Target 4 | 152.85 | | Weekly Target 5 | 155.74 |
Weekly price and volumes for Chevron Corporation
| Date |
Closing |
Open |
Range |
Volume |
Fri 05 December 2025 |
149.95 (-0.78%) |
151.75 |
149.26 - 153.95 |
1.234 times |
Fri 28 November 2025 |
151.13 (0.77%) |
149.82 |
147.74 - 151.52 |
0.8912 times |
Fri 21 November 2025 |
149.98 (-4.85%) |
157.72 |
148.75 - 157.89 |
1.3221 times |
Fri 14 November 2025 |
157.62 (1.66%) |
155.42 |
152.08 - 157.99 |
1.2138 times |
Fri 07 November 2025 |
155.05 (-1.69%) |
153.43 |
152.15 - 156.17 |
0.675 times |
Fri 31 October 2025 |
157.72 (0%) |
155.73 |
155.11 - 159.18 |
0.4049 times |
Fri 31 October 2025 |
157.72 (1.39%) |
155.79 |
153.24 - 159.18 |
1.3599 times |
Fri 24 October 2025 |
155.56 (1.62%) |
153.29 |
152.81 - 158.59 |
0.7901 times |
Fri 17 October 2025 |
153.08 (2.81%) |
150.00 |
149.43 - 154.21 |
1.0762 times |
Fri 10 October 2025 |
148.90 (-3.02%) |
153.85 |
148.89 - 155.00 |
1.0329 times |
Fri 03 October 2025 |
153.54 (-4.13%) |
159.13 |
152.23 - 159.13 |
1.2271 times |
Monthly price and charts ChevronCorporation Strong monthly Stock price targets for ChevronCorporation CVX are 147.26 and 151.95 | Monthly Target 1 | 146.36 | | Monthly Target 2 | 148.16 | | Monthly Target 3 | 151.05333333333 | | Monthly Target 4 | 152.85 | | Monthly Target 5 | 155.74 |
Monthly price and volumes Chevron Corporation
| Date |
Closing |
Open |
Range |
Volume |
Fri 05 December 2025 |
149.95 (-0.78%) |
151.75 |
149.26 - 153.95 |
0.2037 times |
Fri 28 November 2025 |
151.13 (-4.18%) |
153.43 |
147.74 - 157.99 |
0.6771 times |
Fri 31 October 2025 |
157.72 (1.56%) |
154.83 |
148.89 - 159.18 |
0.876 times |
Tue 30 September 2025 |
155.29 (-3.31%) |
160.48 |
152.88 - 161.86 |
0.9797 times |
Fri 29 August 2025 |
160.60 (5.91%) |
152.54 |
149.90 - 161.10 |
0.9898 times |
Thu 31 July 2025 |
151.64 (5.9%) |
143.34 |
142.51 - 157.21 |
1.6028 times |
Mon 30 June 2025 |
143.19 (4.75%) |
138.49 |
136.43 - 152.15 |
1.1062 times |
Fri 30 May 2025 |
136.70 (0.47%) |
135.42 |
133.77 - 143.71 |
1.0733 times |
Wed 30 April 2025 |
136.06 (-18.67%) |
167.29 |
132.04 - 168.60 |
1.3897 times |
Mon 31 March 2025 |
167.29 (5.47%) |
159.46 |
147.74 - 168.96 |
1.1016 times |
Fri 28 February 2025 |
158.62 (6.32%) |
149.00 |
147.80 - 158.99 |
0.7486 times |
DMA SMA EMA moving averages of Chevron Corporation CVX
DMA (daily moving average) of Chevron Corporation CVX
| DMA period | DMA value | | 5 day DMA | 151.31 | | 12 day DMA | 150.63 | | 20 day DMA | 152.47 | | 35 day DMA | 153.45 | | 50 day DMA | 153.51 | | 100 day DMA | 154.68 | | 150 day DMA | 150.74 | | 200 day DMA | 150.43 | EMA (exponential moving average) of Chevron Corporation CVX
| EMA period | EMA current | EMA prev | EMA prev2 | | 5 day EMA | 150.96 | 151.46 | 151.06 | | 12 day EMA | 151.37 | 151.63 | 151.51 | | 20 day EMA | 152 | 152.22 | 152.22 | | 35 day EMA | 152.81 | 152.98 | 153.02 | | 50 day EMA | 153.66 | 153.81 | 153.87 |
SMA (simple moving average) of Chevron Corporation CVX
| SMA period | SMA current | SMA prev | SMA prev2 | | 5 day SMA | 151.31 | 151.54 | 151.01 | | 12 day SMA | 150.63 | 150.93 | 151.14 | | 20 day SMA | 152.47 | 152.62 | 152.64 | | 35 day SMA | 153.45 | 153.5 | 153.5 | | 50 day SMA | 153.51 | 153.73 | 153.86 | | 100 day SMA | 154.68 | 154.68 | 154.66 | | 150 day SMA | 150.74 | 150.65 | 150.54 | | 200 day SMA | 150.43 | 150.47 | 150.5 |
|
|
