CvrEnergy CVI full analysis,charts,indicators,moving averages,SMA,DMA,EMA,ADX,MACD,RSICvr Energy CVI WideScreen charts, DMA,SMA,EMA technical analysis, forecast prediction, by indicators ADX,MACD,RSI,CCI NYSE stock exchange
operates under Energy sector & deals in Integrated Oil Companies
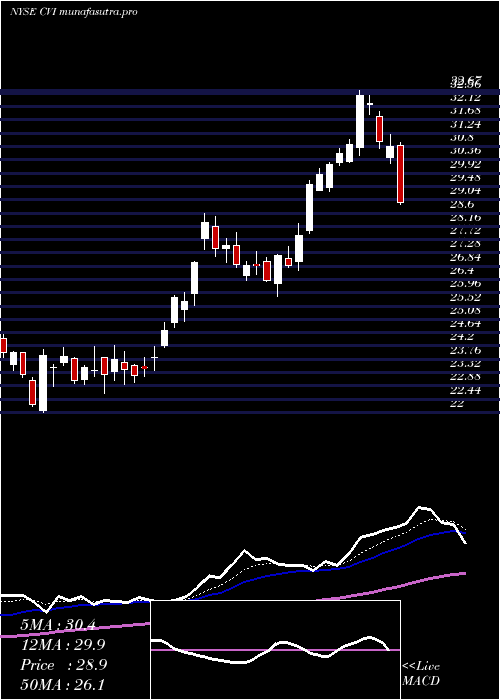
Daily price and charts and targets CvrEnergy Strong Daily Stock price targets for CvrEnergy CVI are 34.51 and 35.46 | Daily Target 1 | 33.79 | | Daily Target 2 | 34.27 | | Daily Target 3 | 34.74 | | Daily Target 4 | 35.22 | | Daily Target 5 | 35.69 |
Daily price and volume Cvr Energy
| Date |
Closing |
Open |
Range |
Volume |
Tue 21 October 2025 |
34.75 (-0.4%) |
34.73 |
34.26 - 35.21 |
1.0599 times |
Mon 20 October 2025 |
34.89 (1.72%) |
34.42 |
34.41 - 35.06 |
0.5453 times |
Fri 17 October 2025 |
34.30 (3.03%) |
33.58 |
33.32 - 34.47 |
1.1477 times |
Thu 16 October 2025 |
33.29 (-2.94%) |
34.49 |
32.93 - 34.51 |
0.8927 times |
Wed 15 October 2025 |
34.30 (-2.83%) |
35.68 |
34.22 - 35.99 |
0.8299 times |
Tue 14 October 2025 |
35.30 (-0.06%) |
34.65 |
34.54 - 36.03 |
0.9194 times |
Mon 13 October 2025 |
35.32 (-3.07%) |
35.15 |
34.40 - 35.42 |
0.7666 times |
Tue 07 October 2025 |
36.44 (-0.82%) |
36.66 |
35.70 - 36.72 |
1.5289 times |
Mon 06 October 2025 |
36.74 (-0.54%) |
38.36 |
36.55 - 38.36 |
1.0353 times |
Fri 03 October 2025 |
36.94 (-0.7%) |
37.75 |
36.83 - 38.30 |
1.2743 times |
Thu 02 October 2025 |
37.20 (1.72%) |
36.40 |
36.08 - 37.33 |
1.1181 times |
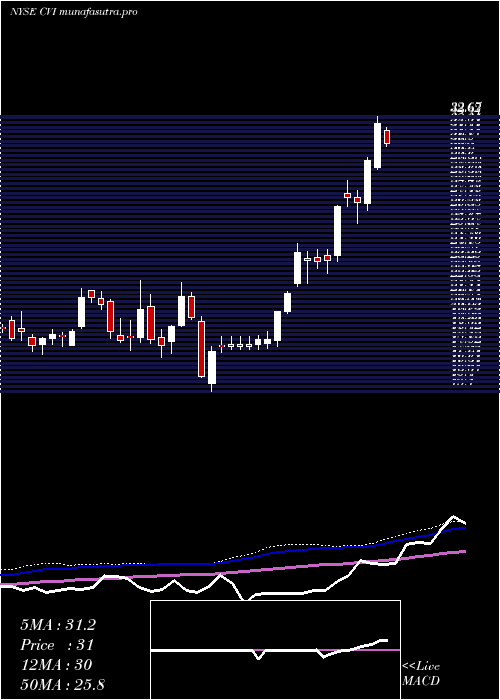
Weekly price and charts CvrEnergy Strong weekly Stock price targets for CvrEnergy CVI are 34.51 and 35.46 | Weekly Target 1 | 33.79 | | Weekly Target 2 | 34.27 | | Weekly Target 3 | 34.74 | | Weekly Target 4 | 35.22 | | Weekly Target 5 | 35.69 |
Weekly price and volumes for Cvr Energy
| Date |
Closing |
Open |
Range |
Volume |
Tue 21 October 2025 |
34.75 (1.31%) |
34.42 |
34.26 - 35.21 |
0.2289 times |
Fri 17 October 2025 |
34.30 (-5.87%) |
35.15 |
32.93 - 36.03 |
0.6497 times |
Tue 07 October 2025 |
36.44 (-1.35%) |
38.36 |
35.70 - 38.36 |
0.3657 times |
Fri 03 October 2025 |
36.94 (1.74%) |
36.74 |
35.50 - 38.30 |
1.029 times |
Fri 26 September 2025 |
36.31 (5.98%) |
34.42 |
34.10 - 36.51 |
1.4008 times |
Fri 19 September 2025 |
34.26 (9.95%) |
30.55 |
29.81 - 34.32 |
1.7526 times |
Fri 12 September 2025 |
31.16 (-0.86%) |
31.41 |
30.09 - 33.24 |
1.77 times |
Fri 05 September 2025 |
31.43 (3.08%) |
30.70 |
30.25 - 32.21 |
1.0141 times |
Fri 29 August 2025 |
30.49 (0%) |
29.72 |
29.51 - 30.59 |
0.3273 times |
Fri 29 August 2025 |
30.49 (11.77%) |
27.47 |
27.29 - 30.59 |
1.4618 times |
Fri 22 August 2025 |
27.28 (0.81%) |
27.00 |
25.89 - 29.15 |
1.5433 times |
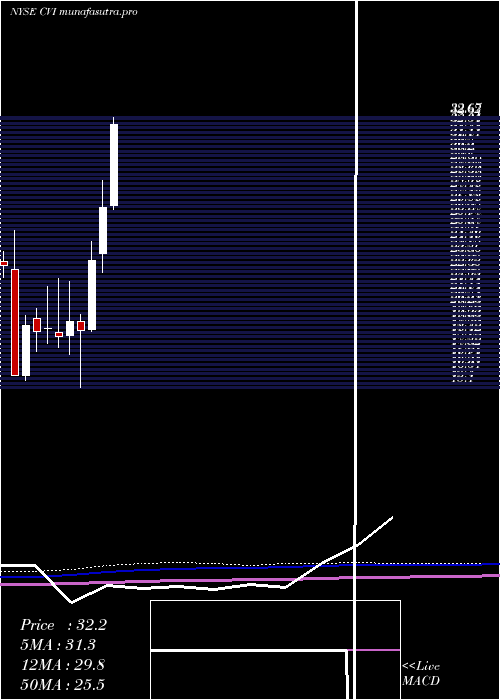
Monthly price and charts CvrEnergy Strong monthly Stock price targets for CvrEnergy CVI are 31.13 and 36.56 | Monthly Target 1 | 29.92 | | Monthly Target 2 | 32.33 | | Monthly Target 3 | 35.346666666667 | | Monthly Target 4 | 37.76 | | Monthly Target 5 | 40.78 |
Monthly price and volumes Cvr Energy
| Date |
Closing |
Open |
Range |
Volume |
Tue 21 October 2025 |
34.75 (-4.74%) |
36.04 |
32.93 - 38.36 |
0.5484 times |
Tue 30 September 2025 |
36.48 (19.65%) |
30.70 |
29.81 - 37.50 |
1.9471 times |
Fri 29 August 2025 |
30.49 (13.85%) |
26.23 |
24.74 - 30.59 |
1.697 times |
Thu 31 July 2025 |
26.78 (-0.26%) |
26.98 |
24.36 - 32.67 |
0.9057 times |
Mon 30 June 2025 |
26.85 (14.79%) |
23.82 |
22.63 - 28.60 |
0.7696 times |
Fri 30 May 2025 |
23.39 (24.02%) |
18.88 |
18.75 - 24.59 |
0.8337 times |
Wed 30 April 2025 |
18.86 (-2.78%) |
19.39 |
15.10 - 19.84 |
0.8828 times |
Mon 31 March 2025 |
19.40 (5.32%) |
18.52 |
17.25 - 22.04 |
0.8072 times |
Fri 28 February 2025 |
18.42 (-2.8%) |
18.68 |
17.70 - 22.20 |
0.7959 times |
Fri 31 January 2025 |
18.95 (1.12%) |
18.95 |
17.99 - 21.67 |
0.8124 times |
Tue 31 December 2024 |
18.74 (-2.09%) |
19.61 |
17.48 - 20.23 |
1.2543 times |
DMA SMA EMA moving averages of Cvr Energy CVI
DMA (daily moving average) of Cvr Energy CVI
| DMA period | DMA value | | 5 day DMA | 34.31 | | 12 day DMA | 35.5 | | 20 day DMA | 35.57 | | 35 day DMA | 33.91 | | 50 day DMA | 31.98 | | 100 day DMA | 29.53 | | 150 day DMA | 26.29 | | 200 day DMA | 24.55 | EMA (exponential moving average) of Cvr Energy CVI
| EMA period | EMA current | EMA prev | EMA prev2 | | 5 day EMA | 34.69 | 34.66 | 34.55 | | 12 day EMA | 34.99 | 35.03 | 35.05 | | 20 day EMA | 34.72 | 34.72 | 34.7 | | 35 day EMA | 33.44 | 33.36 | 33.27 | | 50 day EMA | 31.73 | 31.61 | 31.48 |
SMA (simple moving average) of Cvr Energy CVI
| SMA period | SMA current | SMA prev | SMA prev2 | | 5 day SMA | 34.31 | 34.42 | 34.5 | | 12 day SMA | 35.5 | 35.65 | 35.81 | | 20 day SMA | 35.57 | 35.53 | 35.44 | | 35 day SMA | 33.91 | 33.77 | 33.62 | | 50 day SMA | 31.98 | 31.81 | 31.65 | | 100 day SMA | 29.53 | 29.42 | 29.3 | | 150 day SMA | 26.29 | 26.19 | 26.07 | | 200 day SMA | 24.55 | 24.47 | 24.39 |
|
|
