Cubesmart CUBE full analysis,charts,indicators,moving averages,SMA,DMA,EMA,ADX,MACD,RSICubesmart CUBE WideScreen charts, DMA,SMA,EMA technical analysis, forecast prediction, by indicators ADX,MACD,RSI,CCI NYSE stock exchange
operates under Consumer Services sector & deals in Real Estate Investment Trusts
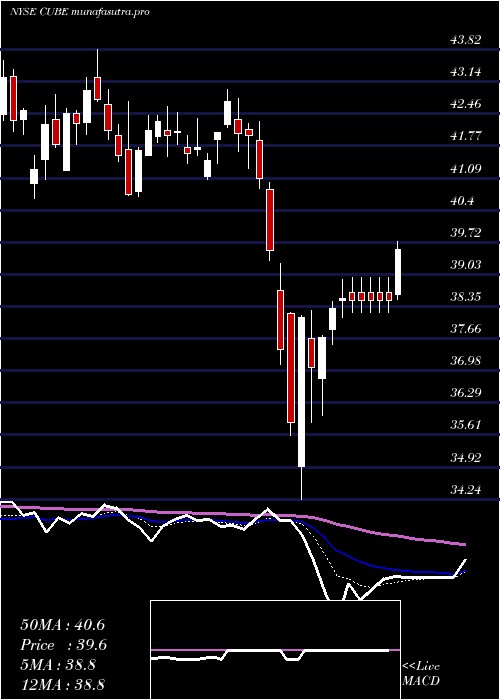
Daily price and charts and targets Cubesmart Strong Daily Stock price targets for Cubesmart CUBE are 36.53 and 37 | Daily Target 1 | 36.18 | | Daily Target 2 | 36.41 | | Daily Target 3 | 36.653333333333 | | Daily Target 4 | 36.88 | | Daily Target 5 | 37.12 |
Daily price and volume Cubesmart
| Date |
Closing |
Open |
Range |
Volume |
Fri 05 December 2025 |
36.63 (-0.49%) |
36.43 |
36.43 - 36.90 |
1.1304 times |
Thu 04 December 2025 |
36.81 (-0.54%) |
36.93 |
36.72 - 37.20 |
0.8203 times |
Wed 03 December 2025 |
37.01 (-0.16%) |
37.20 |
36.90 - 37.59 |
0.9458 times |
Tue 02 December 2025 |
37.07 (0.35%) |
37.11 |
36.61 - 37.12 |
1.1611 times |
Mon 01 December 2025 |
36.94 (-0.78%) |
36.83 |
36.53 - 37.31 |
0.715 times |
Fri 28 November 2025 |
37.23 (-0.32%) |
37.23 |
37.18 - 37.52 |
0.4157 times |
Wed 26 November 2025 |
37.35 (1.14%) |
36.81 |
36.65 - 37.58 |
1.0302 times |
Tue 25 November 2025 |
36.93 (1.76%) |
36.53 |
36.53 - 37.22 |
0.8327 times |
Mon 24 November 2025 |
36.29 (0.06%) |
36.31 |
36.10 - 36.61 |
1.9132 times |
Fri 21 November 2025 |
36.27 (1.8%) |
35.93 |
35.81 - 36.68 |
1.0355 times |
Thu 20 November 2025 |
35.63 (-0.64%) |
36.02 |
35.59 - 36.16 |
1.0053 times |
Weekly price and charts Cubesmart Strong weekly Stock price targets for Cubesmart CUBE are 35.95 and 37.11 | Weekly Target 1 | 35.72 | | Weekly Target 2 | 36.18 | | Weekly Target 3 | 36.883333333333 | | Weekly Target 4 | 37.34 | | Weekly Target 5 | 38.04 |
Weekly price and volumes for Cubesmart
| Date |
Closing |
Open |
Range |
Volume |
Fri 05 December 2025 |
36.63 (-1.61%) |
36.83 |
36.43 - 37.59 |
1.026 times |
Fri 28 November 2025 |
37.23 (2.65%) |
36.31 |
36.10 - 37.58 |
0.9011 times |
Fri 21 November 2025 |
36.27 (-0.96%) |
36.62 |
35.42 - 36.86 |
1.1022 times |
Fri 14 November 2025 |
36.62 (-2.45%) |
37.08 |
36.08 - 37.45 |
0.9994 times |
Fri 07 November 2025 |
37.54 (-0.35%) |
36.83 |
36.75 - 37.87 |
1.0328 times |
Fri 31 October 2025 |
37.67 (0%) |
39.26 |
37.14 - 39.26 |
0.5583 times |
Fri 31 October 2025 |
37.67 (-10.44%) |
41.96 |
37.14 - 42.12 |
1.5365 times |
Fri 24 October 2025 |
42.06 (-0.21%) |
42.30 |
41.59 - 42.64 |
1.0236 times |
Fri 17 October 2025 |
42.15 (7.17%) |
39.66 |
39.36 - 42.22 |
1.0038 times |
Fri 10 October 2025 |
39.33 (-3.37%) |
40.89 |
39.32 - 40.89 |
0.8162 times |
Fri 03 October 2025 |
40.70 (0.47%) |
40.66 |
39.87 - 41.12 |
0.9169 times |
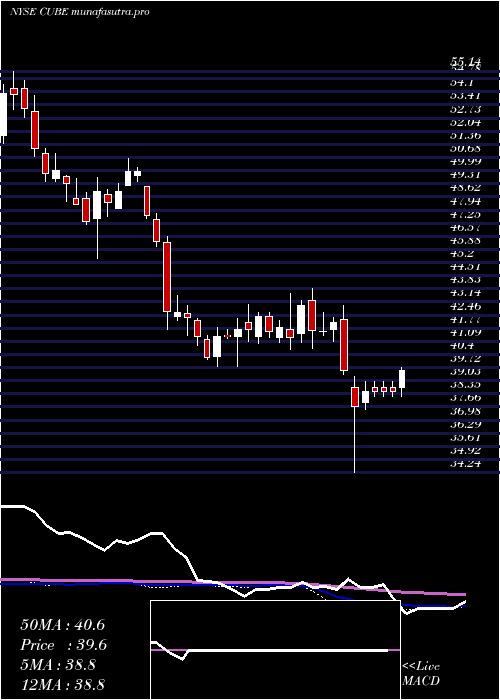
Monthly price and charts Cubesmart Strong monthly Stock price targets for Cubesmart CUBE are 35.95 and 37.11 | Monthly Target 1 | 35.72 | | Monthly Target 2 | 36.18 | | Monthly Target 3 | 36.883333333333 | | Monthly Target 4 | 37.34 | | Monthly Target 5 | 38.04 |
Monthly price and volumes Cubesmart
| Date |
Closing |
Open |
Range |
Volume |
Fri 05 December 2025 |
36.63 (-1.61%) |
36.83 |
36.43 - 37.59 |
0.2384 times |
Fri 28 November 2025 |
37.23 (-1.17%) |
36.83 |
35.42 - 37.87 |
0.9376 times |
Fri 31 October 2025 |
37.67 (-7.35%) |
40.04 |
37.14 - 42.64 |
1.2497 times |
Tue 30 September 2025 |
40.66 (-0.64%) |
40.50 |
39.60 - 42.04 |
1.0616 times |
Fri 29 August 2025 |
40.92 (5.17%) |
39.28 |
38.35 - 41.41 |
0.9606 times |
Thu 31 July 2025 |
38.91 (-8.45%) |
41.83 |
38.58 - 43.63 |
1.1776 times |
Mon 30 June 2025 |
42.50 (-0.61%) |
42.26 |
41.50 - 44.13 |
0.9444 times |
Fri 30 May 2025 |
42.76 (5.14%) |
40.82 |
40.27 - 43.91 |
1.2084 times |
Wed 30 April 2025 |
40.67 (-4.78%) |
42.33 |
34.24 - 42.79 |
1.1842 times |
Mon 31 March 2025 |
42.71 (3.46%) |
41.48 |
40.69 - 43.82 |
1.0375 times |
Fri 28 February 2025 |
41.28 (-1.01%) |
41.36 |
40.65 - 43.59 |
0.8801 times |

DMA SMA EMA moving averages of Cubesmart CUBE
DMA (daily moving average) of Cubesmart CUBE
| DMA period | DMA value | | 5 day DMA | 36.89 | | 12 day DMA | 36.67 | | 20 day DMA | 36.7 | | 35 day DMA | 38.18 | | 50 day DMA | 38.85 | | 100 day DMA | 39.64 | | 150 day DMA | 40.62 | | 200 day DMA | 40.62 | EMA (exponential moving average) of Cubesmart CUBE
| EMA period | EMA current | EMA prev | EMA prev2 | | 5 day EMA | 36.82 | 36.92 | 36.98 | | 12 day EMA | 36.86 | 36.9 | 36.92 | | 20 day EMA | 37.12 | 37.17 | 37.21 | | 35 day EMA | 37.84 | 37.91 | 37.97 | | 50 day EMA | 38.74 | 38.83 | 38.91 |
SMA (simple moving average) of Cubesmart CUBE
| SMA period | SMA current | SMA prev | SMA prev2 | | 5 day SMA | 36.89 | 37.01 | 37.12 | | 12 day SMA | 36.67 | 36.64 | 36.58 | | 20 day SMA | 36.7 | 36.71 | 36.76 | | 35 day SMA | 38.18 | 38.33 | 38.45 | | 50 day SMA | 38.85 | 38.92 | 38.97 | | 100 day SMA | 39.64 | 39.69 | 39.73 | | 150 day SMA | 40.62 | 40.65 | 40.68 | | 200 day SMA | 40.62 | 40.64 | 40.67 |
|
|
