CustomersBancorp CUBB full analysis,charts,indicators,moving averages,SMA,DMA,EMA,ADX,MACD,RSICustomers Bancorp CUBB WideScreen charts, DMA,SMA,EMA technical analysis, forecast prediction, by indicators ADX,MACD,RSI,CCI NYSE stock exchange
Daily price and charts and targets CustomersBancorp Strong Daily Stock price targets for CustomersBancorp CUBB are 20.8 and 21.2 | Daily Target 1 | 20.47 | | Daily Target 2 | 20.73 | | Daily Target 3 | 20.866666666667 | | Daily Target 4 | 21.13 | | Daily Target 5 | 21.27 |
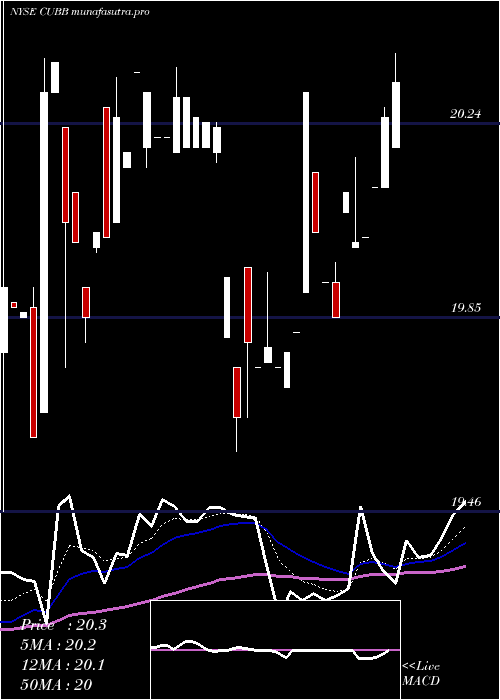
Daily price and volume Customers Bancorp
| Date |
Closing |
Open |
Range |
Volume |
Mon 20 October 2025 |
21.00 (0.24%) |
20.71 |
20.60 - 21.00 |
0.6611 times |
Fri 17 October 2025 |
20.95 (0.96%) |
20.81 |
20.81 - 20.95 |
0.2066 times |
Thu 16 October 2025 |
20.75 (-0.48%) |
20.85 |
20.75 - 21.00 |
2.1485 times |
Wed 15 October 2025 |
20.85 (-2.11%) |
21.20 |
20.66 - 21.44 |
4.0904 times |
Tue 14 October 2025 |
21.30 (-0.7%) |
21.39 |
21.27 - 21.50 |
0.9916 times |
Mon 13 October 2025 |
21.45 (0.33%) |
21.38 |
21.32 - 21.45 |
0.3099 times |
Thu 09 October 2025 |
21.38 (-0.56%) |
21.45 |
21.38 - 21.45 |
0.062 times |
Wed 08 October 2025 |
21.50 (0.7%) |
21.49 |
21.49 - 21.50 |
0.1033 times |
Tue 07 October 2025 |
21.35 (0.9%) |
21.28 |
21.28 - 21.35 |
0.1033 times |
Mon 06 October 2025 |
21.16 (-1.72%) |
21.46 |
21.10 - 21.50 |
1.3234 times |
Fri 03 October 2025 |
21.53 (0.37%) |
21.53 |
21.53 - 21.53 |
0.2066 times |
Weekly price and charts CustomersBancorp Strong weekly Stock price targets for CustomersBancorp CUBB are 20.8 and 21.2 | Weekly Target 1 | 20.47 | | Weekly Target 2 | 20.73 | | Weekly Target 3 | 20.866666666667 | | Weekly Target 4 | 21.13 | | Weekly Target 5 | 21.27 |
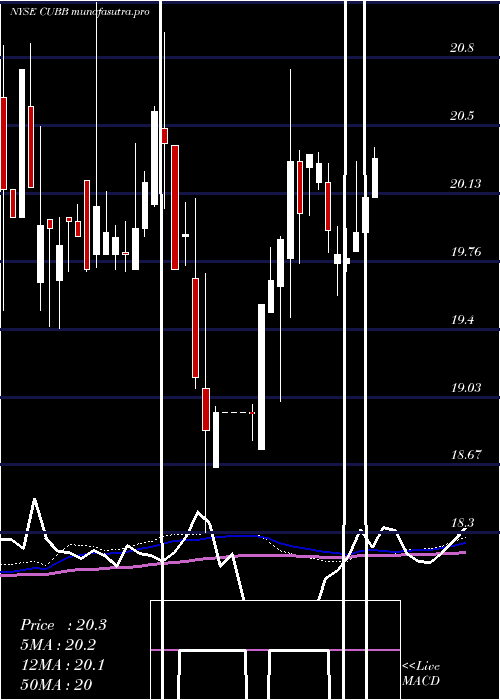
Weekly price and volumes for Customers Bancorp
| Date |
Closing |
Open |
Range |
Volume |
Mon 20 October 2025 |
21.00 (0.24%) |
20.71 |
20.60 - 21.00 |
0.2521 times |
Fri 17 October 2025 |
20.95 (-2.01%) |
21.38 |
20.66 - 21.50 |
2.9538 times |
Thu 09 October 2025 |
21.38 (-0.7%) |
21.46 |
21.10 - 21.50 |
0.607 times |
Fri 03 October 2025 |
21.53 (0%) |
21.53 |
21.40 - 21.59 |
0.3348 times |
Fri 26 September 2025 |
21.53 (-0.19%) |
21.60 |
21.45 - 21.68 |
0.5671 times |
Fri 19 September 2025 |
21.57 (0.09%) |
21.20 |
21.20 - 21.79 |
1.7959 times |
Thu 11 September 2025 |
21.55 (0.84%) |
21.50 |
21.39 - 21.66 |
0.8979 times |
Fri 05 September 2025 |
21.37 (-0.7%) |
21.50 |
21.25 - 21.50 |
0.5986 times |
Fri 29 August 2025 |
21.52 (0%) |
21.52 |
21.38 - 21.55 |
0.4726 times |
Fri 29 August 2025 |
21.52 (0.84%) |
21.15 |
21.15 - 21.64 |
1.5202 times |
Fri 22 August 2025 |
21.34 (0.28%) |
21.00 |
21.00 - 21.35 |
1.3233 times |
Monthly price and charts CustomersBancorp Strong monthly Stock price targets for CustomersBancorp CUBB are 20.34 and 21.27 | Monthly Target 1 | 20.11 | | Monthly Target 2 | 20.56 | | Monthly Target 3 | 21.043333333333 | | Monthly Target 4 | 21.49 | | Monthly Target 5 | 21.97 |
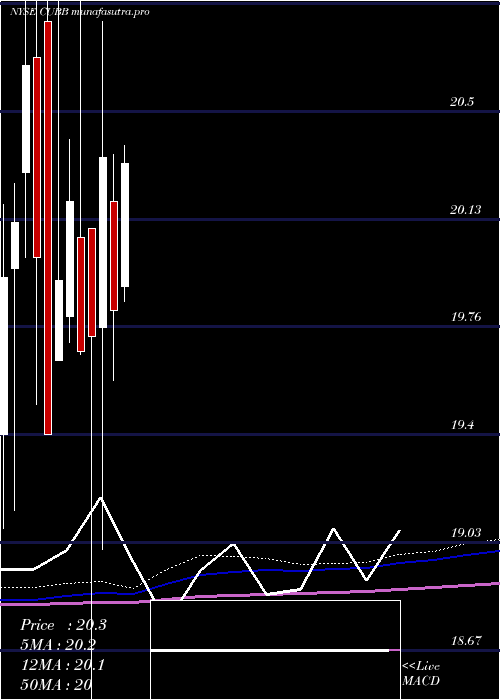
Monthly price and volumes Customers Bancorp
| Date |
Closing |
Open |
Range |
Volume |
Mon 20 October 2025 |
21.00 (-2.1%) |
21.40 |
20.60 - 21.53 |
0.9089 times |
Tue 30 September 2025 |
21.45 (-0.33%) |
21.50 |
21.20 - 21.79 |
0.9079 times |
Fri 29 August 2025 |
21.52 (5.23%) |
20.38 |
20.30 - 21.64 |
1.0116 times |
Thu 31 July 2025 |
20.45 (3.18%) |
19.90 |
19.85 - 20.46 |
0.6865 times |
Mon 30 June 2025 |
19.82 (-2.56%) |
20.19 |
19.58 - 20.35 |
0.4593 times |
Fri 30 May 2025 |
20.34 (3.09%) |
19.76 |
19.01 - 20.80 |
0.9204 times |
Wed 30 April 2025 |
19.73 (0.25%) |
20.10 |
18.30 - 20.10 |
1.6894 times |
Mon 31 March 2025 |
19.68 (-2.53%) |
20.07 |
19.67 - 21.00 |
1.9428 times |
Fri 28 February 2025 |
20.19 (1.36%) |
19.80 |
19.71 - 20.40 |
0.8364 times |
Fri 31 January 2025 |
19.92 (2.68%) |
19.65 |
19.65 - 21.16 |
0.6367 times |
Tue 31 December 2024 |
19.40 (-3%) |
20.80 |
19.40 - 20.94 |
0.5934 times |
DMA SMA EMA moving averages of Customers Bancorp CUBB
DMA (daily moving average) of Customers Bancorp CUBB
| DMA period | DMA value | | 5 day DMA | 20.97 | | 12 day DMA | 21.22 | | 20 day DMA | 21.35 | | 35 day DMA | 21.42 | | 50 day DMA | 21.36 | | 100 day DMA | 20.76 | | 150 day DMA | 20.38 | | 200 day DMA | 20.29 | EMA (exponential moving average) of Customers Bancorp CUBB
| EMA period | EMA current | EMA prev | EMA prev2 | | 5 day EMA | 21.01 | 21.02 | 21.05 | | 12 day EMA | 21.17 | 21.2 | 21.24 | | 20 day EMA | 21.25 | 21.28 | 21.31 | | 35 day EMA | 21.28 | 21.3 | 21.32 | | 50 day EMA | 21.25 | 21.26 | 21.27 |
SMA (simple moving average) of Customers Bancorp CUBB
| SMA period | SMA current | SMA prev | SMA prev2 | | 5 day SMA | 20.97 | 21.06 | 21.15 | | 12 day SMA | 21.22 | 21.26 | 21.3 | | 20 day SMA | 21.35 | 21.37 | 21.41 | | 35 day SMA | 21.42 | 21.42 | 21.44 | | 50 day SMA | 21.36 | 21.36 | 21.35 | | 100 day SMA | 20.76 | 20.75 | 20.74 | | 150 day SMA | 20.38 | 20.37 | 20.37 | | 200 day SMA | 20.29 | 20.28 | 20.28 |
|
|
