CortevaInc CTVA full analysis,charts,indicators,moving averages,SMA,DMA,EMA,ADX,MACD,RSICorteva Inc CTVA WideScreen charts, DMA,SMA,EMA technical analysis, forecast prediction, by indicators ADX,MACD,RSI,CCI NYSE stock exchange
Daily price and charts and targets CortevaInc Strong Daily Stock price targets for CortevaInc CTVA are 65.42 and 66.52 | Daily Target 1 | 65.22 | | Daily Target 2 | 65.61 | | Daily Target 3 | 66.32 | | Daily Target 4 | 66.71 | | Daily Target 5 | 67.42 |
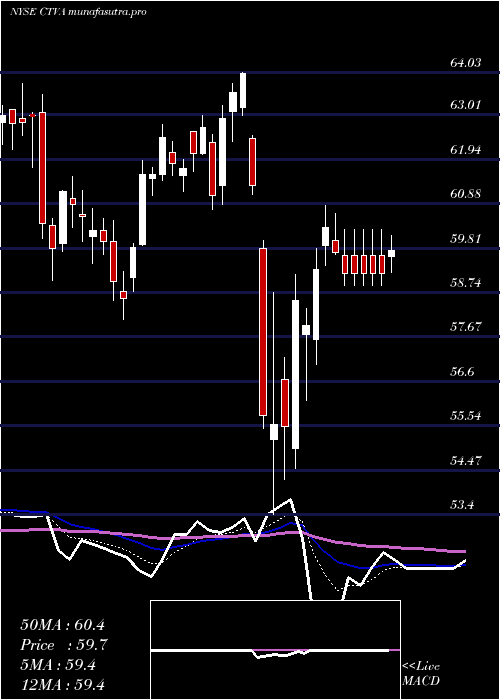
Daily price and volume Corteva Inc
| Date |
Closing |
Open |
Range |
Volume |
Fri 05 December 2025 |
66.00 (-0.44%) |
66.17 |
65.93 - 67.03 |
1.5848 times |
Thu 04 December 2025 |
66.29 (1.52%) |
65.81 |
65.63 - 66.45 |
1.079 times |
Wed 03 December 2025 |
65.30 (-0.46%) |
65.80 |
65.27 - 66.24 |
1.1504 times |
Tue 02 December 2025 |
65.60 (-1.41%) |
66.87 |
65.27 - 67.01 |
0.7709 times |
Mon 01 December 2025 |
66.54 (-1.38%) |
67.15 |
66.52 - 67.84 |
1.0356 times |
Fri 28 November 2025 |
67.47 (1.23%) |
66.69 |
66.68 - 67.72 |
0.5852 times |
Wed 26 November 2025 |
66.65 (0.89%) |
65.91 |
65.71 - 66.96 |
0.6105 times |
Tue 25 November 2025 |
66.06 (0.61%) |
66.02 |
65.48 - 66.58 |
0.5165 times |
Mon 24 November 2025 |
65.66 (0.18%) |
65.54 |
65.08 - 65.85 |
1.1325 times |
Fri 21 November 2025 |
65.54 (1.8%) |
64.78 |
64.67 - 66.59 |
1.5347 times |
Thu 20 November 2025 |
64.38 (-0.46%) |
65.02 |
64.20 - 65.96 |
1.7583 times |
Weekly price and charts CortevaInc Strong weekly Stock price targets for CortevaInc CTVA are 64.35 and 66.92 | Weekly Target 1 | 63.8 | | Weekly Target 2 | 64.9 | | Weekly Target 3 | 66.37 | | Weekly Target 4 | 67.47 | | Weekly Target 5 | 68.94 |
Weekly price and volumes for Corteva Inc
| Date |
Closing |
Open |
Range |
Volume |
Fri 05 December 2025 |
66.00 (-2.18%) |
67.15 |
65.27 - 67.84 |
1.1082 times |
Fri 28 November 2025 |
67.47 (2.94%) |
65.54 |
65.08 - 67.72 |
0.5609 times |
Fri 21 November 2025 |
65.54 (-0.7%) |
66.34 |
63.56 - 66.59 |
1.2126 times |
Fri 14 November 2025 |
66.00 (2.88%) |
64.31 |
64.06 - 67.02 |
0.9345 times |
Fri 07 November 2025 |
64.15 (4.41%) |
61.99 |
61.28 - 64.83 |
1.0767 times |
Fri 31 October 2025 |
61.44 (0%) |
61.33 |
61.05 - 61.94 |
0.269 times |
Fri 31 October 2025 |
61.44 (-3.49%) |
64.02 |
60.94 - 64.56 |
1.2975 times |
Fri 24 October 2025 |
63.66 (3.68%) |
61.96 |
61.54 - 63.95 |
1.0621 times |
Fri 17 October 2025 |
61.40 (-0.7%) |
62.27 |
60.95 - 63.04 |
1.2719 times |
Fri 10 October 2025 |
61.83 (-2.43%) |
63.74 |
61.83 - 65.61 |
1.2066 times |
Fri 03 October 2025 |
63.37 (-6.93%) |
68.40 |
60.46 - 68.67 |
2.1008 times |

Monthly price and charts CortevaInc Strong monthly Stock price targets for CortevaInc CTVA are 64.35 and 66.92 | Monthly Target 1 | 63.8 | | Monthly Target 2 | 64.9 | | Monthly Target 3 | 66.37 | | Monthly Target 4 | 67.47 | | Monthly Target 5 | 68.94 |
Monthly price and volumes Corteva Inc
| Date |
Closing |
Open |
Range |
Volume |
Fri 05 December 2025 |
66.00 (-2.18%) |
67.15 |
65.27 - 67.84 |
0.2441 times |
Fri 28 November 2025 |
67.47 (9.81%) |
61.99 |
61.28 - 67.72 |
0.8335 times |
Fri 31 October 2025 |
61.44 (-9.15%) |
66.90 |
60.46 - 66.90 |
1.4584 times |
Tue 30 September 2025 |
67.63 (-8.84%) |
73.72 |
65.91 - 75.91 |
1.2866 times |
Fri 29 August 2025 |
74.19 (2.86%) |
71.65 |
68.70 - 75.16 |
1.1595 times |
Thu 31 July 2025 |
72.13 (-3.22%) |
74.51 |
71.67 - 77.41 |
1.0191 times |
Mon 30 June 2025 |
74.53 (5.27%) |
70.69 |
70.15 - 75.05 |
1.1755 times |
Fri 30 May 2025 |
70.80 (14.21%) |
61.47 |
61.21 - 71.01 |
0.9385 times |
Wed 30 April 2025 |
61.99 (-1.49%) |
63.08 |
53.40 - 64.03 |
1.0038 times |
Mon 31 March 2025 |
62.93 (-0.08%) |
63.06 |
58.09 - 63.50 |
0.881 times |
Fri 28 February 2025 |
62.98 (-3.51%) |
64.32 |
60.92 - 65.90 |
0.9835 times |

DMA SMA EMA moving averages of Corteva Inc CTVA
DMA (daily moving average) of Corteva Inc CTVA
| DMA period | DMA value | | 5 day DMA | 65.95 | | 12 day DMA | 65.85 | | 20 day DMA | 65.63 | | 35 day DMA | 64.36 | | 50 day DMA | 64.19 | | 100 day DMA | 68.22 | | 150 day DMA | 69.2 | | 200 day DMA | 67.07 | EMA (exponential moving average) of Corteva Inc CTVA
| EMA period | EMA current | EMA prev | EMA prev2 | | 5 day EMA | 66.01 | 66.02 | 65.88 | | 12 day EMA | 65.81 | 65.77 | 65.67 | | 20 day EMA | 65.48 | 65.42 | 65.33 | | 35 day EMA | 65.24 | 65.19 | 65.13 | | 50 day EMA | 64.79 | 64.74 | 64.68 |
SMA (simple moving average) of Corteva Inc CTVA
| SMA period | SMA current | SMA prev | SMA prev2 | | 5 day SMA | 65.95 | 66.24 | 66.31 | | 12 day SMA | 65.85 | 65.72 | 65.52 | | 20 day SMA | 65.63 | 65.49 | 65.36 | | 35 day SMA | 64.36 | 64.22 | 64.1 | | 50 day SMA | 64.19 | 64.22 | 64.28 | | 100 day SMA | 68.22 | 68.29 | 68.34 | | 150 day SMA | 69.2 | 69.18 | 69.15 | | 200 day SMA | 67.07 | 67.06 | 67.04 |
|
|
