ConturaEnergy CTRA full analysis,charts,indicators,moving averages,SMA,DMA,EMA,ADX,MACD,RSIContura Energy CTRA WideScreen charts, DMA,SMA,EMA technical analysis, forecast prediction, by indicators ADX,MACD,RSI,CCI NYSE stock exchange
operates under Energy sector & deals in Coal Mining
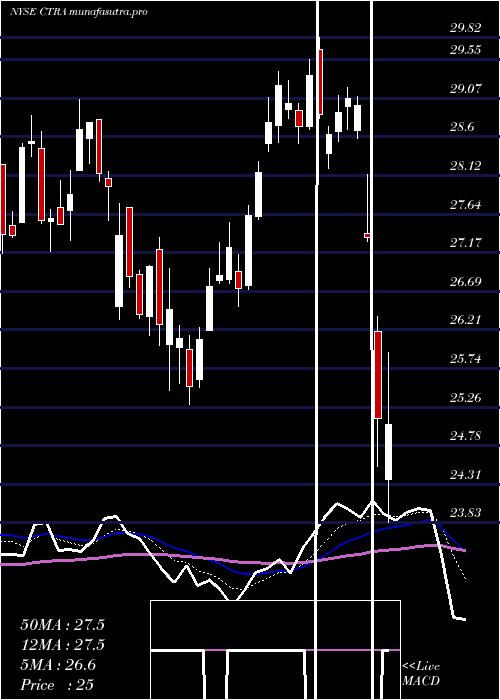
Daily price and charts and targets ConturaEnergy Strong Daily Stock price targets for ConturaEnergy CTRA are 23.18 and 23.79 | Daily Target 1 | 22.69 | | Daily Target 2 | 23.06 | | Daily Target 3 | 23.303333333333 | | Daily Target 4 | 23.67 | | Daily Target 5 | 23.91 |
Daily price and volume Contura Energy
| Date |
Closing |
Open |
Range |
Volume |
Mon 20 October 2025 |
23.42 (2.72%) |
22.99 |
22.94 - 23.55 |
0.6437 times |
Fri 17 October 2025 |
22.80 (0.97%) |
22.54 |
22.46 - 22.92 |
0.5971 times |
Thu 16 October 2025 |
22.58 (-2.67%) |
23.24 |
22.33 - 23.27 |
1.2279 times |
Wed 15 October 2025 |
23.20 (-0.04%) |
23.34 |
23.18 - 23.65 |
1.1296 times |
Tue 14 October 2025 |
23.21 (0.17%) |
22.81 |
22.62 - 23.37 |
0.9643 times |
Mon 13 October 2025 |
23.17 (1.85%) |
22.85 |
22.76 - 23.20 |
0.7784 times |
Fri 10 October 2025 |
22.75 (-3.68%) |
23.39 |
22.75 - 23.67 |
0.8136 times |
Thu 09 October 2025 |
23.62 (-2.52%) |
24.23 |
23.19 - 24.49 |
1.411 times |
Wed 08 October 2025 |
24.23 (-1.22%) |
24.59 |
23.75 - 24.59 |
1.4411 times |
Tue 07 October 2025 |
24.53 (2.89%) |
23.81 |
23.68 - 24.57 |
0.9935 times |
Mon 06 October 2025 |
23.84 (2.32%) |
23.42 |
23.38 - 23.96 |
1.0402 times |
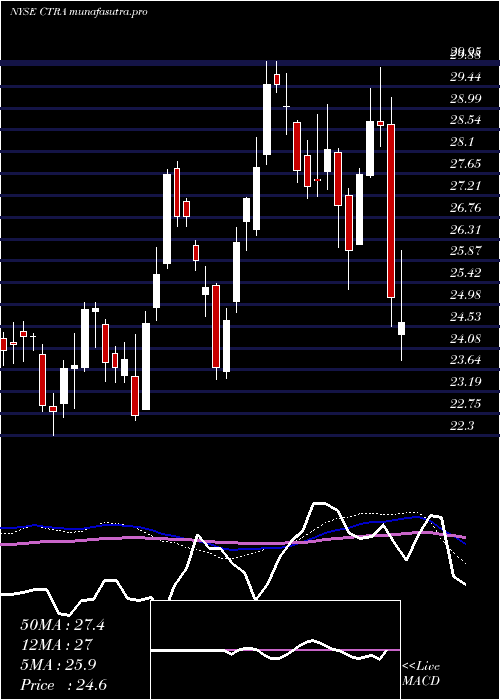
Weekly price and charts ConturaEnergy Strong weekly Stock price targets for ConturaEnergy CTRA are 23.18 and 23.79 | Weekly Target 1 | 22.69 | | Weekly Target 2 | 23.06 | | Weekly Target 3 | 23.303333333333 | | Weekly Target 4 | 23.67 | | Weekly Target 5 | 23.91 |
Weekly price and volumes for Contura Energy
| Date |
Closing |
Open |
Range |
Volume |
Mon 20 October 2025 |
23.42 (2.72%) |
22.99 |
22.94 - 23.55 |
0.2323 times |
Fri 17 October 2025 |
22.80 (0.22%) |
22.85 |
22.33 - 23.65 |
1.6953 times |
Fri 10 October 2025 |
22.75 (-2.36%) |
23.42 |
22.75 - 24.59 |
2.0571 times |
Fri 03 October 2025 |
23.30 (-2.22%) |
23.66 |
23.01 - 24.06 |
1.4258 times |
Fri 26 September 2025 |
23.83 (2.36%) |
23.19 |
22.86 - 24.21 |
1.2305 times |
Fri 19 September 2025 |
23.28 (-4.43%) |
24.30 |
23.24 - 24.69 |
1.1676 times |
Fri 12 September 2025 |
24.36 (1.58%) |
24.19 |
23.72 - 24.74 |
0.7121 times |
Fri 05 September 2025 |
23.98 (-1.88%) |
24.26 |
23.73 - 24.77 |
0.5914 times |
Fri 29 August 2025 |
24.44 (0%) |
24.40 |
24.30 - 24.52 |
0.1033 times |
Fri 29 August 2025 |
24.44 (2.65%) |
23.74 |
23.48 - 24.52 |
0.7846 times |
Fri 22 August 2025 |
23.81 (-0.92%) |
23.71 |
22.91 - 23.84 |
0.7754 times |
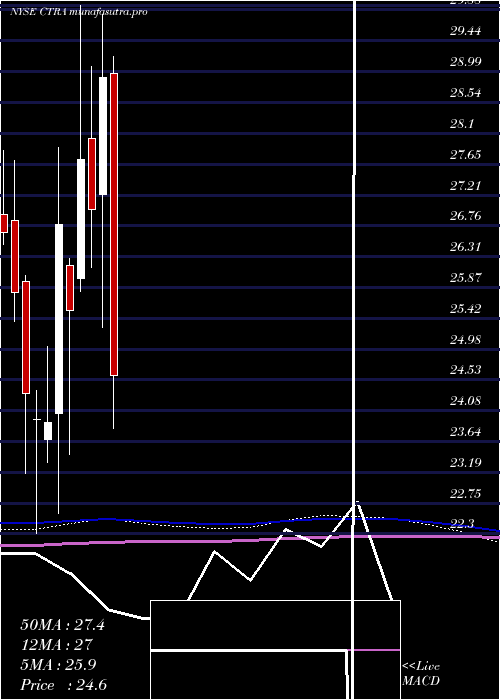
Monthly price and charts ConturaEnergy Strong monthly Stock price targets for ConturaEnergy CTRA are 22.88 and 25.14 | Monthly Target 1 | 21.19 | | Monthly Target 2 | 22.3 | | Monthly Target 3 | 23.446666666667 | | Monthly Target 4 | 24.56 | | Monthly Target 5 | 25.71 |
Monthly price and volumes Contura Energy
| Date |
Closing |
Open |
Range |
Volume |
Mon 20 October 2025 |
23.42 (-0.97%) |
23.36 |
22.33 - 24.59 |
1.1756 times |
Tue 30 September 2025 |
23.65 (-3.23%) |
24.26 |
22.86 - 24.77 |
1.0066 times |
Fri 29 August 2025 |
24.44 (0.21%) |
24.01 |
22.91 - 24.71 |
0.8609 times |
Thu 31 July 2025 |
24.39 (-3.9%) |
25.28 |
22.95 - 25.75 |
1.0082 times |
Mon 30 June 2025 |
25.38 (4.4%) |
24.73 |
24.59 - 27.44 |
0.977 times |
Fri 30 May 2025 |
24.31 (-1.02%) |
24.46 |
22.46 - 25.77 |
1.257 times |
Wed 30 April 2025 |
24.56 (-15.02%) |
28.97 |
23.71 - 29.21 |
0.9267 times |
Mon 31 March 2025 |
28.90 (7.08%) |
27.21 |
25.29 - 29.82 |
0.9795 times |
Fri 28 February 2025 |
26.99 (-2.63%) |
28.02 |
26.15 - 29.06 |
0.7574 times |
Fri 31 January 2025 |
27.72 (8.54%) |
26.00 |
25.81 - 29.95 |
1.0511 times |
Tue 31 December 2024 |
25.54 (-4.63%) |
26.18 |
23.45 - 26.29 |
0.6761 times |
DMA SMA EMA moving averages of Contura Energy CTRA
DMA (daily moving average) of Contura Energy CTRA
| DMA period | DMA value | | 5 day DMA | 23.04 | | 12 day DMA | 23.39 | | 20 day DMA | 23.49 | | 35 day DMA | 23.75 | | 50 day DMA | 23.79 | | 100 day DMA | 24.39 | | 150 day DMA | 24.86 | | 200 day DMA | 25.57 | EMA (exponential moving average) of Contura Energy CTRA
| EMA period | EMA current | EMA prev | EMA prev2 | | 5 day EMA | 23.12 | 22.97 | 23.05 | | 12 day EMA | 23.28 | 23.25 | 23.33 | | 20 day EMA | 23.43 | 23.43 | 23.5 | | 35 day EMA | 23.59 | 23.6 | 23.65 | | 50 day EMA | 23.74 | 23.75 | 23.79 |
SMA (simple moving average) of Contura Energy CTRA
| SMA period | SMA current | SMA prev | SMA prev2 | | 5 day SMA | 23.04 | 22.99 | 22.98 | | 12 day SMA | 23.39 | 23.37 | 23.46 | | 20 day SMA | 23.49 | 23.48 | 23.5 | | 35 day SMA | 23.75 | 23.78 | 23.83 | | 50 day SMA | 23.79 | 23.8 | 23.83 | | 100 day SMA | 24.39 | 24.4 | 24.42 | | 150 day SMA | 24.86 | 24.88 | 24.91 | | 200 day SMA | 25.57 | 25.59 | 25.6 |
|
|
