DuPont CTA-B full analysis,charts,indicators,moving averages,SMA,DMA,EMA,ADX,MACD,RSIDu Pont CTA-B WideScreen charts, DMA,SMA,EMA technical analysis, forecast prediction, by indicators ADX,MACD,RSI,CCI NYSE stock exchange
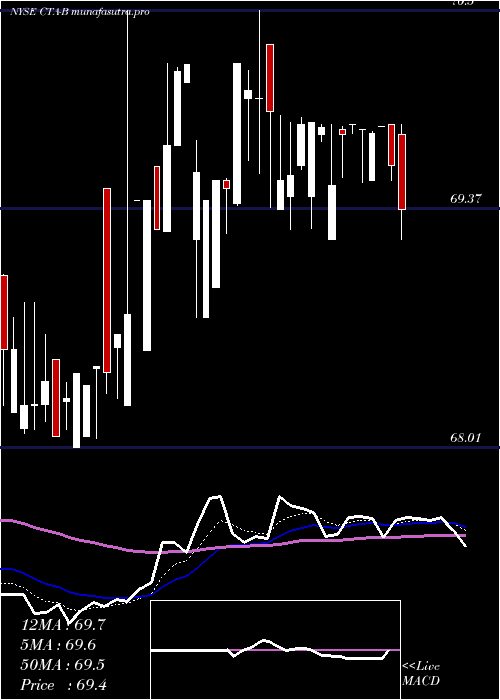
Daily price and charts and targets DuPont Strong Daily Stock price targets for DuPont CTA-B are 68.37 and 68.88 | Daily Target 1 | 67.95 | | Daily Target 2 | 68.28 | | Daily Target 3 | 68.463333333333 | | Daily Target 4 | 68.79 | | Daily Target 5 | 68.97 |
Daily price and volume Du Pont
| Date |
Closing |
Open |
Range |
Volume |
Mon 20 October 2025 |
68.60 (0.15%) |
68.14 |
68.14 - 68.65 |
1.5609 times |
Fri 17 October 2025 |
68.50 (0.29%) |
68.31 |
68.30 - 68.50 |
0.4288 times |
Thu 16 October 2025 |
68.30 (-0.6%) |
68.27 |
67.89 - 68.95 |
0.7376 times |
Wed 15 October 2025 |
68.71 (-0.03%) |
68.00 |
68.00 - 68.90 |
0.5832 times |
Tue 14 October 2025 |
68.73 (0.7%) |
67.88 |
67.88 - 68.73 |
0.9777 times |
Mon 13 October 2025 |
68.25 (-0.16%) |
68.50 |
67.88 - 68.50 |
0.5832 times |
Fri 10 October 2025 |
68.36 (-1.03%) |
68.92 |
67.57 - 68.95 |
1.4923 times |
Thu 09 October 2025 |
69.07 (-0.68%) |
69.40 |
68.58 - 69.48 |
1.4408 times |
Wed 08 October 2025 |
69.54 (-1.29%) |
69.75 |
69.33 - 70.37 |
0.8919 times |
Tue 07 October 2025 |
70.45 (-1.08%) |
70.56 |
69.71 - 71.39 |
1.3036 times |
Mon 06 October 2025 |
71.22 (-0.27%) |
70.52 |
70.52 - 71.44 |
0.2401 times |
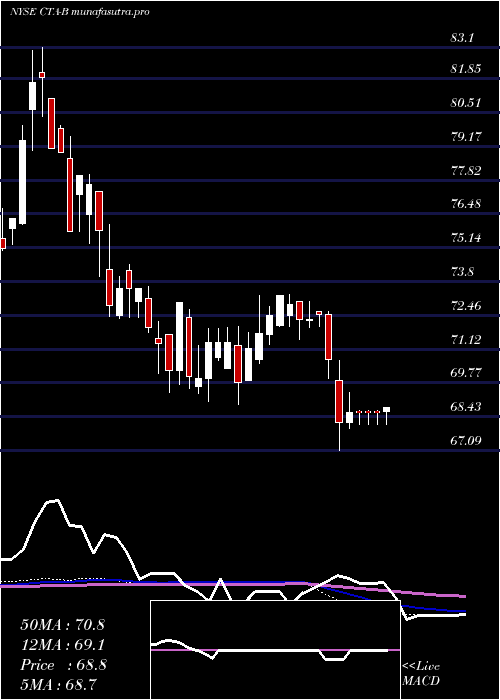
Weekly price and charts DuPont Strong weekly Stock price targets for DuPont CTA-B are 68.37 and 68.88 | Weekly Target 1 | 67.95 | | Weekly Target 2 | 68.28 | | Weekly Target 3 | 68.463333333333 | | Weekly Target 4 | 68.79 | | Weekly Target 5 | 68.97 |
Weekly price and volumes for Du Pont
| Date |
Closing |
Open |
Range |
Volume |
Mon 20 October 2025 |
68.60 (0.15%) |
68.14 |
68.14 - 68.65 |
0.6472 times |
Fri 17 October 2025 |
68.50 (0.2%) |
68.50 |
67.88 - 68.95 |
1.3727 times |
Fri 10 October 2025 |
68.36 (-4.27%) |
70.52 |
67.57 - 71.44 |
2.2262 times |
Fri 03 October 2025 |
71.41 (-1.65%) |
72.11 |
71.16 - 72.52 |
0.6188 times |
Fri 26 September 2025 |
72.61 (0.46%) |
72.49 |
70.83 - 72.91 |
0.5832 times |
Fri 19 September 2025 |
72.28 (-0.96%) |
72.55 |
71.00 - 72.99 |
1.8563 times |
Fri 12 September 2025 |
72.98 (1.71%) |
71.26 |
71.15 - 72.98 |
0.7112 times |
Fri 05 September 2025 |
71.75 (1.49%) |
71.40 |
70.02 - 71.75 |
0.6543 times |
Fri 29 August 2025 |
70.70 (0%) |
70.88 |
70.45 - 71.85 |
0.3698 times |
Fri 29 August 2025 |
70.70 (-1.3%) |
71.65 |
69.80 - 72.48 |
0.9602 times |
Fri 22 August 2025 |
71.63 (2.33%) |
69.31 |
69.16 - 71.97 |
1.3442 times |
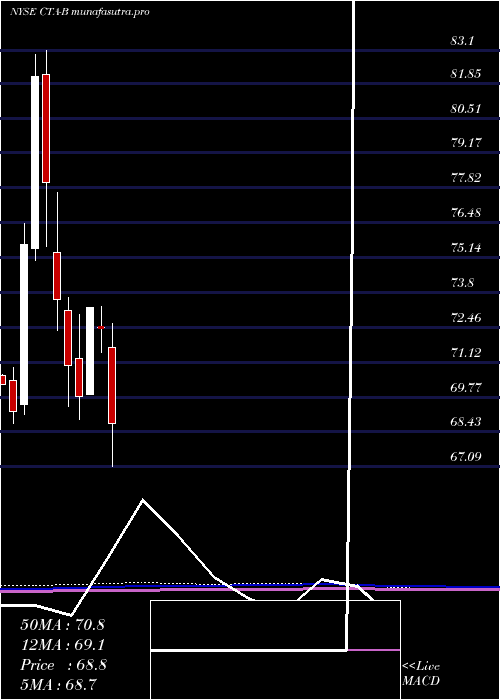
Monthly price and charts DuPont Strong monthly Stock price targets for DuPont CTA-B are 65.61 and 70.56 | Monthly Target 1 | 64.61 | | Monthly Target 2 | 66.61 | | Monthly Target 3 | 69.563333333333 | | Monthly Target 4 | 71.56 | | Monthly Target 5 | 74.51 |
Monthly price and volumes Du Pont
| Date |
Closing |
Open |
Range |
Volume |
Mon 20 October 2025 |
68.60 (-5.25%) |
71.81 |
67.57 - 72.52 |
1.1826 times |
Tue 30 September 2025 |
72.40 (2.4%) |
71.40 |
70.02 - 72.99 |
1.025 times |
Fri 29 August 2025 |
70.70 (1.55%) |
69.79 |
68.79 - 72.48 |
1.4995 times |
Thu 31 July 2025 |
69.62 (-0.16%) |
69.73 |
68.75 - 70.50 |
0.6432 times |
Mon 30 June 2025 |
69.73 (3.01%) |
68.28 |
68.00 - 70.50 |
0.6483 times |
Fri 30 May 2025 |
67.69 (-3.04%) |
72.20 |
67.41 - 72.20 |
0.8639 times |
Wed 30 April 2025 |
69.81 (-3.63%) |
71.68 |
67.09 - 72.60 |
1.1276 times |
Mon 31 March 2025 |
72.44 (-1.07%) |
72.46 |
71.50 - 73.28 |
0.5167 times |
Fri 28 February 2025 |
73.22 (4.9%) |
69.88 |
69.87 - 73.24 |
1.1808 times |
Fri 31 January 2025 |
69.80 (-1.66%) |
71.26 |
68.92 - 72.96 |
1.3124 times |
Tue 31 December 2024 |
70.98 (-3.45%) |
73.12 |
69.40 - 73.60 |
0.8675 times |
DMA SMA EMA moving averages of Du Pont CTA-B
DMA (daily moving average) of Du Pont CTA-B
| DMA period | DMA value | | 5 day DMA | 68.57 | | 12 day DMA | 69.26 | | 20 day DMA | 70.54 | | 35 day DMA | 71.15 | | 50 day DMA | 70.97 | | 100 day DMA | 70.13 | | 150 day DMA | 70.14 | | 200 day DMA | 70.52 | EMA (exponential moving average) of Du Pont CTA-B
| EMA period | EMA current | EMA prev | EMA prev2 | | 5 day EMA | 68.62 | 68.63 | 68.7 | | 12 day EMA | 69.31 | 69.44 | 69.61 | | 20 day EMA | 69.94 | 70.08 | 70.25 | | 35 day EMA | 70.32 | 70.42 | 70.53 | | 50 day EMA | 70.62 | 70.7 | 70.79 |
SMA (simple moving average) of Du Pont CTA-B
| SMA period | SMA current | SMA prev | SMA prev2 | | 5 day SMA | 68.57 | 68.5 | 68.47 | | 12 day SMA | 69.26 | 69.55 | 69.87 | | 20 day SMA | 70.54 | 70.72 | 70.93 | | 35 day SMA | 71.15 | 71.24 | 71.34 | | 50 day SMA | 70.97 | 70.98 | 71.01 | | 100 day SMA | 70.13 | 70.12 | 70.13 | | 150 day SMA | 70.14 | 70.17 | 70.19 | | 200 day SMA | 70.52 | 70.53 | 70.54 |
|
|
