CarriageServices CSV full analysis,charts,indicators,moving averages,SMA,DMA,EMA,ADX,MACD,RSICarriage Services CSV WideScreen charts, DMA,SMA,EMA technical analysis, forecast prediction, by indicators ADX,MACD,RSI,CCI NYSE stock exchange
operates under Consumer Services sector & deals in Other Consumer Services
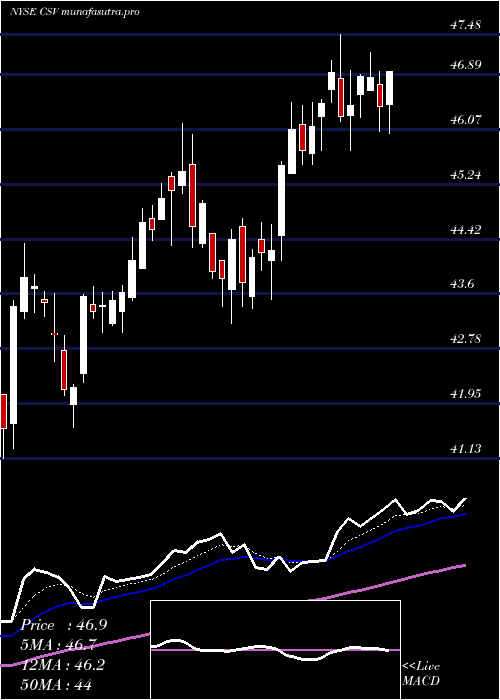
Daily price and charts and targets CarriageServices Strong Daily Stock price targets for CarriageServices CSV are 41.7 and 42.47 | Daily Target 1 | 41.12 | | Daily Target 2 | 41.51 | | Daily Target 3 | 41.893333333333 | | Daily Target 4 | 42.28 | | Daily Target 5 | 42.66 |
Daily price and volume Carriage Services
| Date |
Closing |
Open |
Range |
Volume |
Fri 05 December 2025 |
41.89 (0.1%) |
41.65 |
41.51 - 42.28 |
0.5947 times |
Thu 04 December 2025 |
41.85 (-0.97%) |
42.01 |
41.77 - 42.50 |
0.8159 times |
Wed 03 December 2025 |
42.26 (0.52%) |
42.31 |
41.84 - 42.64 |
1.0169 times |
Tue 02 December 2025 |
42.04 (-1.52%) |
42.89 |
41.93 - 42.89 |
1.2626 times |
Mon 01 December 2025 |
42.69 (-1.41%) |
43.10 |
42.66 - 43.49 |
1.6834 times |
Fri 28 November 2025 |
43.30 (0.84%) |
42.73 |
42.73 - 43.36 |
0.5271 times |
Wed 26 November 2025 |
42.94 (0.68%) |
42.33 |
42.33 - 43.04 |
0.8905 times |
Tue 25 November 2025 |
42.65 (1.74%) |
42.30 |
41.58 - 42.84 |
0.9408 times |
Mon 24 November 2025 |
41.92 (-0.95%) |
42.11 |
41.30 - 42.18 |
1.2166 times |
Fri 21 November 2025 |
42.32 (2.77%) |
41.39 |
41.19 - 42.41 |
1.0514 times |
Thu 20 November 2025 |
41.18 (0.22%) |
41.24 |
41.03 - 41.72 |
0.7972 times |
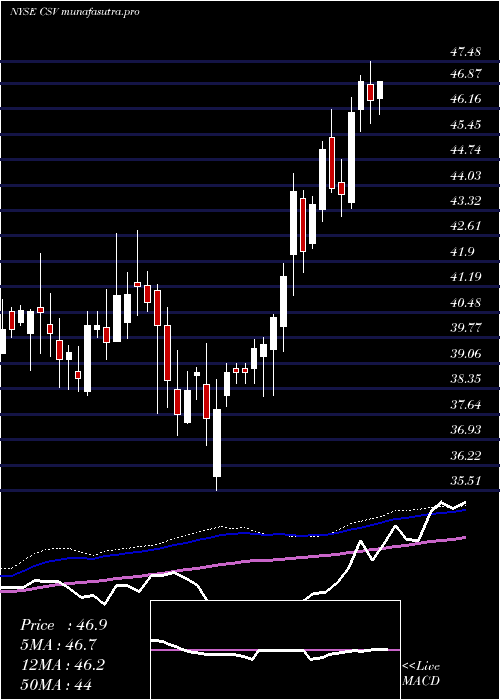
Weekly price and charts CarriageServices Strong weekly Stock price targets for CarriageServices CSV are 40.71 and 42.69 | Weekly Target 1 | 40.32 | | Weekly Target 2 | 41.1 | | Weekly Target 3 | 42.296666666667 | | Weekly Target 4 | 43.08 | | Weekly Target 5 | 44.28 |
Weekly price and volumes for Carriage Services
| Date |
Closing |
Open |
Range |
Volume |
Fri 05 December 2025 |
41.89 (-3.26%) |
43.10 |
41.51 - 43.49 |
1.2427 times |
Fri 28 November 2025 |
43.30 (2.32%) |
42.11 |
41.30 - 43.36 |
0.8268 times |
Fri 21 November 2025 |
42.32 (2.49%) |
41.32 |
39.88 - 42.41 |
1.1863 times |
Fri 14 November 2025 |
41.29 (0.44%) |
41.51 |
40.50 - 41.99 |
1.1284 times |
Fri 07 November 2025 |
41.11 (-8.03%) |
44.00 |
39.88 - 44.54 |
1.6184 times |
Fri 31 October 2025 |
44.70 (0%) |
44.93 |
44.41 - 45.18 |
0.2096 times |
Fri 31 October 2025 |
44.70 (-1.69%) |
45.44 |
43.90 - 45.89 |
1.0999 times |
Fri 24 October 2025 |
45.47 (2.27%) |
44.50 |
43.86 - 46.00 |
1.3098 times |
Fri 17 October 2025 |
44.46 (-3.07%) |
44.21 |
43.81 - 45.25 |
1.0212 times |
Tue 07 October 2025 |
45.87 (-4.12%) |
47.61 |
45.86 - 47.92 |
0.3569 times |
Fri 03 October 2025 |
47.84 (6.05%) |
45.19 |
43.72 - 48.40 |
1.7295 times |
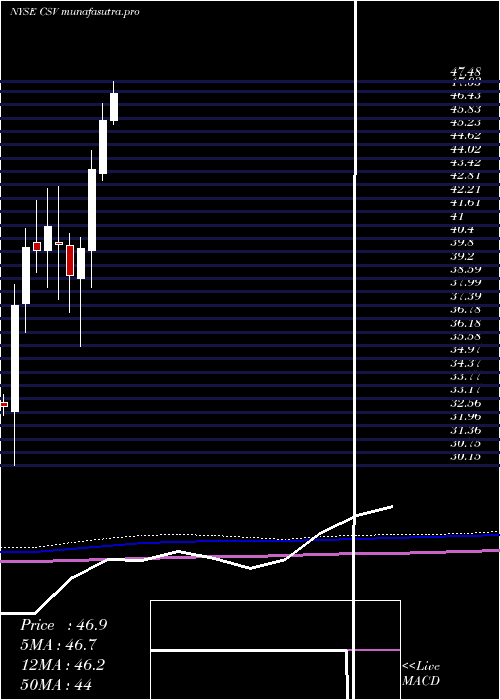
Monthly price and charts CarriageServices Strong monthly Stock price targets for CarriageServices CSV are 40.71 and 42.69 | Monthly Target 1 | 40.32 | | Monthly Target 2 | 41.1 | | Monthly Target 3 | 42.296666666667 | | Monthly Target 4 | 43.08 | | Monthly Target 5 | 44.28 |
Monthly price and volumes Carriage Services
| Date |
Closing |
Open |
Range |
Volume |
Fri 05 December 2025 |
41.89 (-3.26%) |
43.10 |
41.51 - 43.49 |
0.1978 times |
Fri 28 November 2025 |
43.30 (-3.13%) |
44.00 |
39.88 - 44.54 |
0.7574 times |
Fri 31 October 2025 |
44.70 (0.36%) |
44.23 |
43.72 - 48.40 |
0.8379 times |
Tue 30 September 2025 |
44.54 (1.74%) |
43.35 |
41.38 - 45.70 |
1.1969 times |
Fri 29 August 2025 |
43.78 (-2.54%) |
44.73 |
43.45 - 49.41 |
1.4346 times |
Thu 31 July 2025 |
44.92 (-1.79%) |
45.70 |
44.31 - 47.48 |
0.7944 times |
Mon 30 June 2025 |
45.74 (5.15%) |
43.34 |
43.02 - 46.47 |
1.0245 times |
Fri 30 May 2025 |
43.50 (8.86%) |
39.88 |
38.17 - 44.35 |
1.2235 times |
Wed 30 April 2025 |
39.96 (3.12%) |
38.60 |
35.51 - 40.43 |
1.2907 times |
Mon 31 March 2025 |
38.75 (-3.39%) |
40.10 |
37.05 - 40.63 |
1.2423 times |
Fri 28 February 2025 |
40.11 (-2.05%) |
40.21 |
37.67 - 42.75 |
1.3193 times |
DMA SMA EMA moving averages of Carriage Services CSV
DMA (daily moving average) of Carriage Services CSV
| DMA period | DMA value | | 5 day DMA | 42.15 | | 12 day DMA | 42.18 | | 20 day DMA | 41.81 | | 35 day DMA | 42.99 | | 50 day DMA | 43.68 | | 100 day DMA | 44.34 | | 150 day DMA | 44.13 | | 200 day DMA | 42.82 | EMA (exponential moving average) of Carriage Services CSV
| EMA period | EMA current | EMA prev | EMA prev2 | | 5 day EMA | 42.1 | 42.21 | 42.39 | | 12 day EMA | 42.17 | 42.22 | 42.29 | | 20 day EMA | 42.34 | 42.39 | 42.45 | | 35 day EMA | 42.85 | 42.91 | 42.97 | | 50 day EMA | 43.54 | 43.61 | 43.68 |
SMA (simple moving average) of Carriage Services CSV
| SMA period | SMA current | SMA prev | SMA prev2 | | 5 day SMA | 42.15 | 42.43 | 42.65 | | 12 day SMA | 42.18 | 42.09 | 42 | | 20 day SMA | 41.81 | 41.8 | 41.89 | | 35 day SMA | 42.99 | 43.05 | 43.15 | | 50 day SMA | 43.68 | 43.75 | 43.79 | | 100 day SMA | 44.34 | 44.38 | 44.43 | | 150 day SMA | 44.13 | 44.11 | 44.1 | | 200 day SMA | 42.82 | 42.82 | 42.82 |
|
|
