CrossTimbers CRT full analysis,charts,indicators,moving averages,SMA,DMA,EMA,ADX,MACD,RSICross Timbers CRT WideScreen charts, DMA,SMA,EMA technical analysis, forecast prediction, by indicators ADX,MACD,RSI,CCI NYSE stock exchange
operates under Energy sector & deals in Oil Gas Production
Daily price and charts and targets CrossTimbers Strong Daily Stock price targets for CrossTimbers CRT are 8.48 and 8.7 | Daily Target 1 | 8.36 | | Daily Target 2 | 8.48 | | Daily Target 3 | 8.5833333333333 | | Daily Target 4 | 8.7 | | Daily Target 5 | 8.8 |
Daily price and volume Cross Timbers
| Date |
Closing |
Open |
Range |
Volume |
Thu 04 December 2025 |
8.59 (0.82%) |
8.59 |
8.47 - 8.69 |
0.3897 times |
Wed 03 December 2025 |
8.52 (1.67%) |
8.34 |
8.29 - 8.55 |
1.5789 times |
Tue 02 December 2025 |
8.38 (-4.77%) |
8.75 |
8.36 - 8.86 |
1.9383 times |
Mon 01 December 2025 |
8.80 (-1.23%) |
8.86 |
8.76 - 8.89 |
0.5921 times |
Fri 28 November 2025 |
8.91 (0.68%) |
8.79 |
8.76 - 8.99 |
0.4504 times |
Wed 26 November 2025 |
8.85 (0.11%) |
8.76 |
8.76 - 8.88 |
0.7743 times |
Tue 25 November 2025 |
8.84 (0.91%) |
8.75 |
8.75 - 8.92 |
1.0121 times |
Mon 24 November 2025 |
8.76 (-0.68%) |
8.77 |
8.75 - 8.78 |
0.587 times |
Fri 21 November 2025 |
8.82 (-0.23%) |
8.83 |
8.80 - 8.99 |
1.8219 times |
Thu 20 November 2025 |
8.84 (-1.23%) |
9.04 |
8.81 - 9.05 |
0.8553 times |
Wed 19 November 2025 |
8.95 (-0.11%) |
8.96 |
8.87 - 9.00 |
1.4777 times |
Weekly price and charts CrossTimbers Strong weekly Stock price targets for CrossTimbers CRT are 8.14 and 8.74 | Weekly Target 1 | 7.99 | | Weekly Target 2 | 8.29 | | Weekly Target 3 | 8.59 | | Weekly Target 4 | 8.89 | | Weekly Target 5 | 9.19 |
Weekly price and volumes for Cross Timbers
| Date |
Closing |
Open |
Range |
Volume |
Thu 04 December 2025 |
8.59 (-3.59%) |
8.86 |
8.29 - 8.89 |
0.6089 times |
Fri 28 November 2025 |
8.91 (1.02%) |
8.77 |
8.75 - 8.99 |
0.3822 times |
Fri 21 November 2025 |
8.82 (-0.79%) |
8.75 |
8.75 - 9.05 |
1.3821 times |
Fri 14 November 2025 |
8.89 (14.41%) |
7.75 |
7.71 - 9.20 |
2.4711 times |
Fri 07 November 2025 |
7.77 (3.88%) |
7.61 |
7.50 - 7.77 |
0.7431 times |
Fri 31 October 2025 |
7.48 (0%) |
7.51 |
7.41 - 7.51 |
0.1473 times |
Fri 31 October 2025 |
7.48 (-4.96%) |
7.63 |
7.40 - 7.79 |
0.9753 times |
Fri 24 October 2025 |
7.87 (10.07%) |
7.09 |
7.07 - 8.00 |
1.2328 times |
Fri 17 October 2025 |
7.15 (-5.05%) |
7.57 |
7.12 - 7.73 |
1.3767 times |
Fri 10 October 2025 |
7.53 (-1.7%) |
7.60 |
7.50 - 7.75 |
0.6805 times |
Fri 03 October 2025 |
7.66 (0.92%) |
7.79 |
7.38 - 7.81 |
0.6791 times |
Monthly price and charts CrossTimbers Strong monthly Stock price targets for CrossTimbers CRT are 8.14 and 8.74 | Monthly Target 1 | 7.99 | | Monthly Target 2 | 8.29 | | Monthly Target 3 | 8.59 | | Monthly Target 4 | 8.89 | | Monthly Target 5 | 9.19 |
Monthly price and volumes Cross Timbers
| Date |
Closing |
Open |
Range |
Volume |
Thu 04 December 2025 |
8.59 (-3.59%) |
8.86 |
8.29 - 8.89 |
0.1683 times |
Fri 28 November 2025 |
8.91 (19.12%) |
7.61 |
7.50 - 9.20 |
1.3759 times |
Fri 31 October 2025 |
7.48 (-0.8%) |
7.50 |
7.07 - 8.00 |
1.324 times |
Tue 30 September 2025 |
7.54 (-14.32%) |
8.75 |
7.14 - 8.81 |
1.1361 times |
Fri 29 August 2025 |
8.80 (-3.93%) |
9.08 |
8.46 - 9.08 |
0.8069 times |
Thu 31 July 2025 |
9.16 (-7.38%) |
9.83 |
9.15 - 9.99 |
0.8503 times |
Mon 30 June 2025 |
9.89 (-0.8%) |
10.02 |
9.40 - 10.38 |
0.9307 times |
Fri 30 May 2025 |
9.97 (-4.04%) |
10.45 |
9.88 - 10.70 |
0.9765 times |
Wed 30 April 2025 |
10.39 (-21.11%) |
13.20 |
9.20 - 13.31 |
1.2797 times |
Mon 31 March 2025 |
13.17 (20.38%) |
10.94 |
10.38 - 13.22 |
1.1517 times |
Fri 28 February 2025 |
10.94 (4.29%) |
10.32 |
10.23 - 11.36 |
0.9447 times |

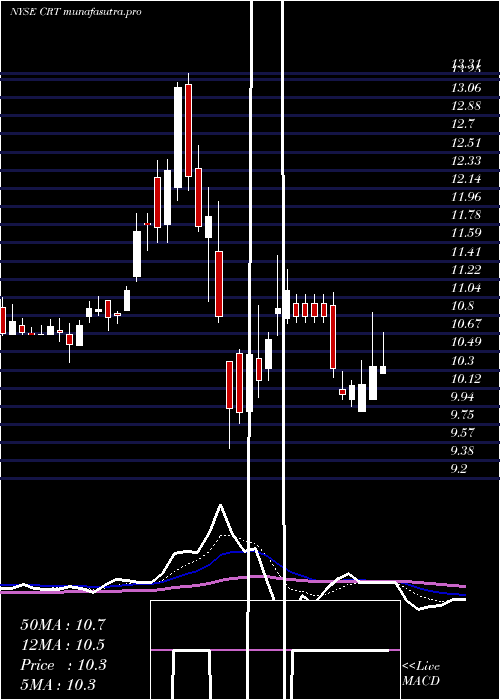
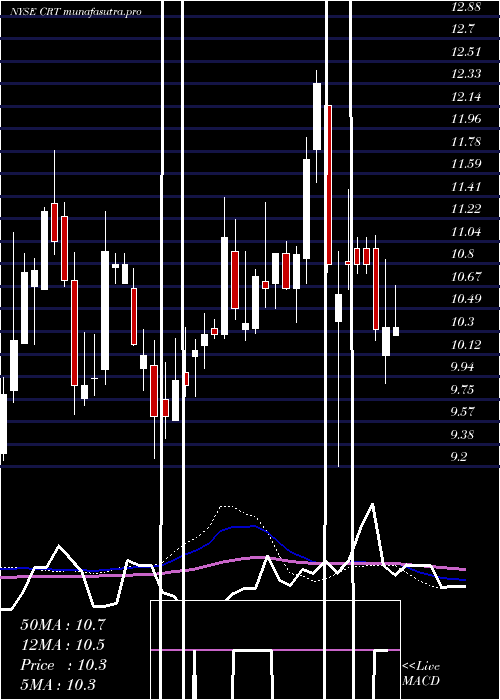
DMA SMA EMA moving averages of Cross Timbers CRT
DMA (daily moving average) of Cross Timbers CRT
| DMA period | DMA value | | 5 day DMA | 8.64 | | 12 day DMA | 8.77 | | 20 day DMA | 8.6 | | 35 day DMA | 8.1 | | 50 day DMA | 7.94 | | 100 day DMA | 8.31 | | 150 day DMA | 8.85 | | 200 day DMA | 9.36 | EMA (exponential moving average) of Cross Timbers CRT
| EMA period | EMA current | EMA prev | EMA prev2 | | 5 day EMA | 8.62 | 8.63 | 8.69 | | 12 day EMA | 8.64 | 8.65 | 8.67 | | 20 day EMA | 8.51 | 8.5 | 8.5 | | 35 day EMA | 8.29 | 8.27 | 8.26 | | 50 day EMA | 7.97 | 7.94 | 7.92 |
SMA (simple moving average) of Cross Timbers CRT
| SMA period | SMA current | SMA prev | SMA prev2 | | 5 day SMA | 8.64 | 8.69 | 8.76 | | 12 day SMA | 8.77 | 8.79 | 8.82 | | 20 day SMA | 8.6 | 8.55 | 8.5 | | 35 day SMA | 8.1 | 8.07 | 8.04 | | 50 day SMA | 7.94 | 7.91 | 7.89 | | 100 day SMA | 8.31 | 8.32 | 8.33 | | 150 day SMA | 8.85 | 8.86 | 8.88 | | 200 day SMA | 9.36 | 9.37 | 9.38 |
|
|
