SalesforceCom CRM full analysis,charts,indicators,moving averages,SMA,DMA,EMA,ADX,MACD,RSISalesforce Com CRM WideScreen charts, DMA,SMA,EMA technical analysis, forecast prediction, by indicators ADX,MACD,RSI,CCI NYSE stock exchange
operates under Technology sector & deals in Computer Software Prepackaged Software
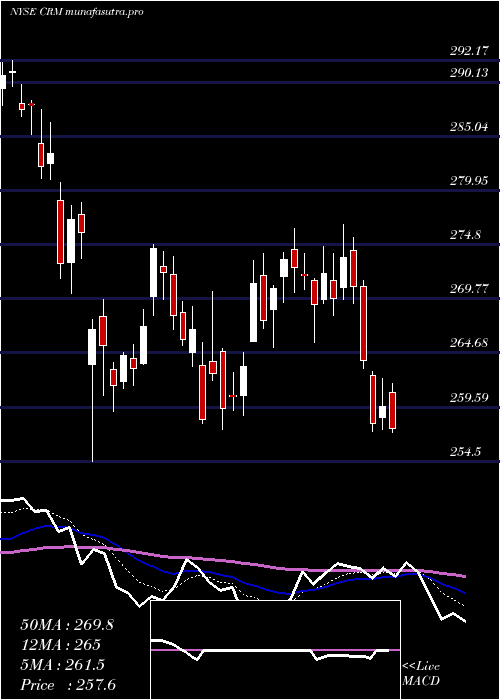
Daily price and charts and targets SalesforceCom Strong Daily Stock price targets for SalesforceCom CRM are 253.72 and 268.76 | Daily Target 1 | 241.4 | | Daily Target 2 | 250.99 | | Daily Target 3 | 256.43666666667 | | Daily Target 4 | 266.03 | | Daily Target 5 | 271.48 |
Daily price and volume Salesforce Com
| Date |
Closing |
Open |
Range |
Volume |
Fri 05 December 2025 |
260.59 (5.25%) |
248.55 |
246.84 - 261.88 |
1.2631 times |
Thu 04 December 2025 |
247.59 (3.72%) |
243.58 |
237.60 - 248.97 |
1.5764 times |
Wed 03 December 2025 |
238.72 (1.67%) |
235.36 |
233.16 - 239.26 |
1.885 times |
Tue 02 December 2025 |
234.81 (0.85%) |
234.02 |
231.62 - 236.65 |
0.4803 times |
Mon 01 December 2025 |
232.83 (0.99%) |
228.67 |
228.60 - 234.25 |
0.7705 times |
Fri 28 November 2025 |
230.54 (1.07%) |
229.00 |
228.63 - 232.56 |
0.5049 times |
Wed 26 November 2025 |
228.11 (-2.57%) |
233.72 |
226.00 - 234.20 |
0.6001 times |
Tue 25 November 2025 |
234.12 (3.25%) |
226.80 |
226.52 - 234.63 |
1.3996 times |
Mon 24 November 2025 |
226.76 (-0.15%) |
227.30 |
225.04 - 229.06 |
0.5062 times |
Fri 21 November 2025 |
227.11 (0.77%) |
224.86 |
221.96 - 228.68 |
1.014 times |
Thu 20 November 2025 |
225.37 (-1.1%) |
229.24 |
223.30 - 231.07 |
1.0287 times |
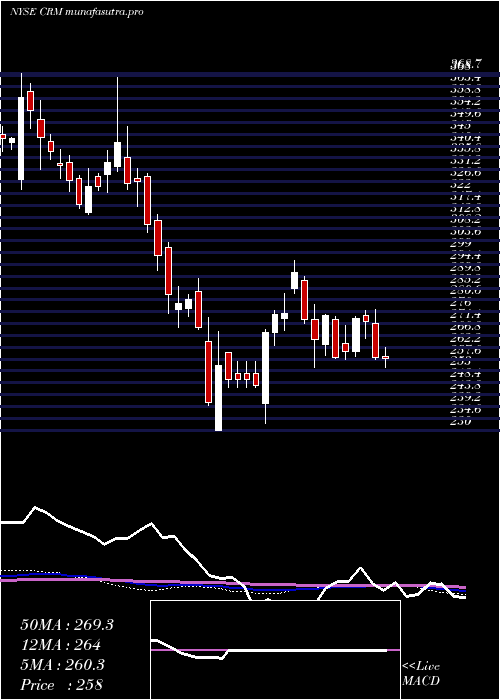
Weekly price and charts SalesforceCom Strong weekly Stock price targets for SalesforceCom CRM are 244.6 and 277.88 | Weekly Target 1 | 217.08 | | Weekly Target 2 | 238.83 | | Weekly Target 3 | 250.35666666667 | | Weekly Target 4 | 272.11 | | Weekly Target 5 | 283.64 |
Weekly price and volumes for Salesforce Com
| Date |
Closing |
Open |
Range |
Volume |
Fri 05 December 2025 |
260.59 (13.03%) |
228.67 |
228.60 - 261.88 |
1.4809 times |
Fri 28 November 2025 |
230.54 (1.51%) |
227.30 |
225.04 - 234.63 |
0.7462 times |
Fri 21 November 2025 |
227.11 (-6.79%) |
242.07 |
221.96 - 242.83 |
1.1399 times |
Fri 14 November 2025 |
243.66 (1.58%) |
240.00 |
235.08 - 248.43 |
0.8491 times |
Fri 07 November 2025 |
239.88 (-7.88%) |
258.11 |
234.48 - 260.69 |
0.6871 times |
Fri 31 October 2025 |
260.41 (0%) |
254.79 |
252.63 - 261.82 |
0.2332 times |
Fri 31 October 2025 |
260.41 (2.17%) |
257.08 |
249.04 - 261.82 |
1.15 times |
Fri 24 October 2025 |
254.88 (4.85%) |
245.47 |
244.00 - 267.13 |
1.0326 times |
Fri 17 October 2025 |
243.08 (1.39%) |
242.89 |
235.90 - 256.74 |
2.0849 times |
Tue 07 October 2025 |
239.74 (-0.24%) |
240.50 |
235.41 - 250.47 |
0.5961 times |
Fri 03 October 2025 |
240.31 (-1.28%) |
244.72 |
233.51 - 245.82 |
1.326 times |
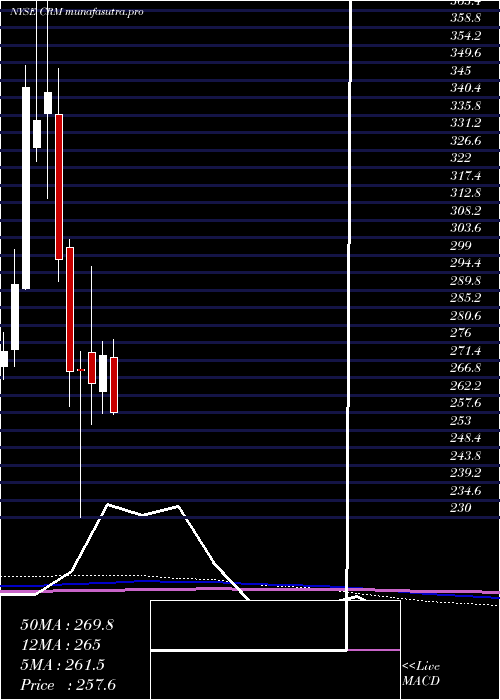
Monthly price and charts SalesforceCom Strong monthly Stock price targets for SalesforceCom CRM are 244.6 and 277.88 | Monthly Target 1 | 217.08 | | Monthly Target 2 | 238.83 | | Monthly Target 3 | 250.35666666667 | | Monthly Target 4 | 272.11 | | Monthly Target 5 | 283.64 |
Monthly price and volumes Salesforce Com
| Date |
Closing |
Open |
Range |
Volume |
Fri 05 December 2025 |
260.59 (13.03%) |
228.67 |
228.60 - 261.88 |
0.304 times |
Fri 28 November 2025 |
230.54 (-11.47%) |
258.11 |
221.96 - 260.69 |
0.7025 times |
Fri 31 October 2025 |
260.41 (9.88%) |
236.49 |
233.51 - 267.13 |
1.199 times |
Tue 30 September 2025 |
237.00 (-7.51%) |
254.82 |
234.62 - 258.00 |
1.533 times |
Fri 29 August 2025 |
256.25 (-0.81%) |
254.99 |
226.48 - 257.64 |
1.2188 times |
Thu 31 July 2025 |
258.33 (-5.27%) |
272.08 |
254.52 - 276.80 |
0.8956 times |
Mon 30 June 2025 |
272.69 (2.76%) |
263.11 |
257.47 - 276.38 |
1.1522 times |
Fri 30 May 2025 |
265.37 (-1.24%) |
273.40 |
254.50 - 296.05 |
1.0828 times |
Wed 30 April 2025 |
268.71 (0.13%) |
268.86 |
230.00 - 273.63 |
0.9576 times |
Mon 31 March 2025 |
268.36 (-9.9%) |
301.00 |
259.19 - 303.07 |
0.9544 times |
Fri 28 February 2025 |
297.85 (-12.83%) |
335.97 |
292.15 - 348.04 |
0.977 times |
DMA SMA EMA moving averages of Salesforce Com CRM
DMA (daily moving average) of Salesforce Com CRM
| DMA period | DMA value | | 5 day DMA | 242.91 | | 12 day DMA | 234.54 | | 20 day DMA | 237.05 | | 35 day DMA | 244.38 | | 50 day DMA | 243.65 | | 100 day DMA | 247.21 | | 150 day DMA | 255.64 | | 200 day DMA | 260.67 | EMA (exponential moving average) of Salesforce Com CRM
| EMA period | EMA current | EMA prev | EMA prev2 | | 5 day EMA | 246.08 | 238.82 | 234.43 | | 12 day EMA | 240.1 | 236.37 | 234.33 | | 20 day EMA | 239.83 | 237.65 | 236.6 | | 35 day EMA | 240.62 | 239.44 | 238.96 | | 50 day EMA | 243.75 | 243.06 | 242.87 |
SMA (simple moving average) of Salesforce Com CRM
| SMA period | SMA current | SMA prev | SMA prev2 | | 5 day SMA | 242.91 | 236.9 | 233 | | 12 day SMA | 234.54 | 232.26 | 231.38 | | 20 day SMA | 237.05 | 235.98 | 236.24 | | 35 day SMA | 244.38 | 243.97 | 243.65 | | 50 day SMA | 243.65 | 243.43 | 243.42 | | 100 day SMA | 247.21 | 247.19 | 247.35 | | 150 day SMA | 255.64 | 255.68 | 255.81 | | 200 day SMA | 260.67 | 261.02 | 261.41 |
|
|
