ComstockResources CRK full analysis,charts,indicators,moving averages,SMA,DMA,EMA,ADX,MACD,RSIComstock Resources CRK WideScreen charts, DMA,SMA,EMA technical analysis, forecast prediction, by indicators ADX,MACD,RSI,CCI NYSE stock exchange
operates under Energy sector & deals in Oil Gas Production
Daily price and charts and targets ComstockResources Strong Daily Stock price targets for ComstockResources CRK are 26.61 and 27.43 | Daily Target 1 | 25.98 | | Daily Target 2 | 26.41 | | Daily Target 3 | 26.803333333333 | | Daily Target 4 | 27.23 | | Daily Target 5 | 27.62 |
Daily price and volume Comstock Resources
| Date |
Closing |
Open |
Range |
Volume |
Thu 04 December 2025 |
26.83 (0.22%) |
26.71 |
26.38 - 27.20 |
0.8337 times |
Wed 03 December 2025 |
26.77 (5.56%) |
25.62 |
25.57 - 26.97 |
1.1815 times |
Tue 02 December 2025 |
25.36 (-4.27%) |
26.36 |
25.26 - 26.41 |
1.2309 times |
Mon 01 December 2025 |
26.49 (-1.38%) |
26.85 |
26.12 - 26.94 |
0.9191 times |
Fri 28 November 2025 |
26.86 (5.5%) |
25.64 |
25.57 - 26.88 |
0.5422 times |
Wed 26 November 2025 |
25.46 (1.27%) |
25.20 |
25.20 - 26.21 |
0.649 times |
Tue 25 November 2025 |
25.14 (-0.16%) |
24.76 |
24.15 - 25.15 |
1.0473 times |
Mon 24 November 2025 |
25.18 (4.22%) |
23.80 |
23.40 - 25.30 |
1.0754 times |
Fri 21 November 2025 |
24.16 (1.26%) |
23.97 |
23.16 - 24.22 |
1.2253 times |
Thu 20 November 2025 |
23.86 (-2.05%) |
24.50 |
23.85 - 26.15 |
1.2957 times |
Wed 19 November 2025 |
24.36 (-2.48%) |
25.20 |
24.32 - 25.25 |
1.2831 times |
Weekly price and charts ComstockResources Strong weekly Stock price targets for ComstockResources CRK are 25.08 and 27.02 | Weekly Target 1 | 24.49 | | Weekly Target 2 | 25.66 | | Weekly Target 3 | 26.43 | | Weekly Target 4 | 27.6 | | Weekly Target 5 | 28.37 |
Weekly price and volumes for Comstock Resources
| Date |
Closing |
Open |
Range |
Volume |
Thu 04 December 2025 |
26.83 (-0.11%) |
26.85 |
25.26 - 27.20 |
0.7941 times |
Fri 28 November 2025 |
26.86 (11.18%) |
23.80 |
23.40 - 26.88 |
0.6318 times |
Fri 21 November 2025 |
24.16 (-4.51%) |
25.00 |
23.16 - 26.15 |
1.2878 times |
Fri 14 November 2025 |
25.30 (9.9%) |
23.96 |
22.64 - 25.96 |
1.5429 times |
Fri 07 November 2025 |
23.02 (22.77%) |
19.25 |
18.00 - 23.04 |
1.15 times |
Fri 31 October 2025 |
18.75 (0%) |
18.60 |
18.28 - 18.84 |
0.2469 times |
Fri 31 October 2025 |
18.75 (4.92%) |
18.06 |
17.08 - 18.90 |
1.1558 times |
Fri 24 October 2025 |
17.87 (3%) |
17.61 |
17.17 - 18.63 |
0.9886 times |
Fri 17 October 2025 |
17.35 (-5.81%) |
18.50 |
16.89 - 19.74 |
1.0653 times |
Fri 10 October 2025 |
18.42 (-14.05%) |
21.63 |
18.37 - 22.09 |
1.1367 times |
Fri 03 October 2025 |
21.43 (8.73%) |
19.71 |
19.46 - 21.83 |
1.386 times |

Monthly price and charts ComstockResources Strong monthly Stock price targets for ComstockResources CRK are 25.08 and 27.02 | Monthly Target 1 | 24.49 | | Monthly Target 2 | 25.66 | | Monthly Target 3 | 26.43 | | Monthly Target 4 | 27.6 | | Monthly Target 5 | 28.37 |
Monthly price and volumes Comstock Resources
| Date |
Closing |
Open |
Range |
Volume |
Thu 04 December 2025 |
26.83 (-0.11%) |
26.85 |
25.26 - 27.20 |
0.1912 times |
Fri 28 November 2025 |
26.86 (43.25%) |
19.25 |
18.00 - 26.88 |
1.1103 times |
Fri 31 October 2025 |
18.75 (-5.45%) |
19.72 |
16.89 - 22.09 |
1.2899 times |
Tue 30 September 2025 |
19.83 (22.94%) |
15.84 |
15.15 - 20.70 |
1.2516 times |
Fri 29 August 2025 |
16.13 (-9.74%) |
17.68 |
14.65 - 17.77 |
1.0279 times |
Thu 31 July 2025 |
17.87 (-35.42%) |
27.48 |
17.74 - 27.49 |
1.2372 times |
Mon 30 June 2025 |
27.67 (18.76%) |
24.21 |
23.34 - 31.17 |
1.0827 times |
Fri 30 May 2025 |
23.30 (27.53%) |
18.42 |
18.13 - 24.70 |
0.8358 times |
Wed 30 April 2025 |
18.27 (-10.18%) |
20.19 |
16.27 - 21.64 |
1.0915 times |
Mon 31 March 2025 |
20.34 (13.13%) |
18.16 |
16.47 - 20.73 |
0.8819 times |
Fri 28 February 2025 |
17.98 (-3.12%) |
19.20 |
17.15 - 21.00 |
0.9314 times |

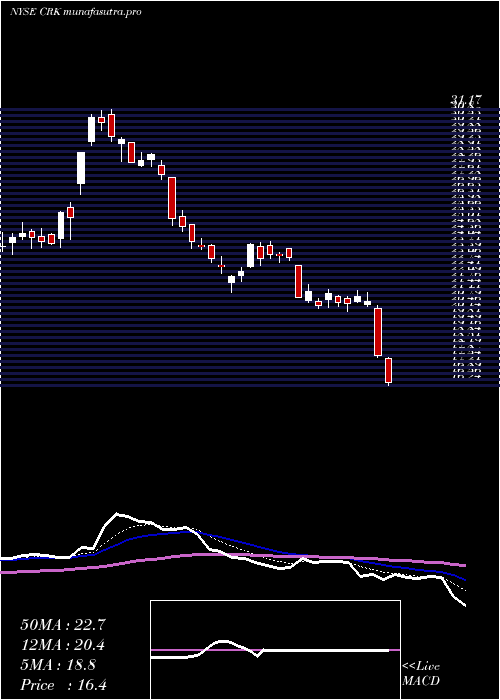
DMA SMA EMA moving averages of Comstock Resources CRK
DMA (daily moving average) of Comstock Resources CRK
| DMA period | DMA value | | 5 day DMA | 26.46 | | 12 day DMA | 25.45 | | 20 day DMA | 24.96 | | 35 day DMA | 22.09 | | 50 day DMA | 21.53 | | 100 day DMA | 19.46 | | 150 day DMA | 21.13 | | 200 day DMA | 20.59 | EMA (exponential moving average) of Comstock Resources CRK
| EMA period | EMA current | EMA prev | EMA prev2 | | 5 day EMA | 26.33 | 26.08 | 25.73 | | 12 day EMA | 25.54 | 25.3 | 25.03 | | 20 day EMA | 24.59 | 24.35 | 24.1 | | 35 day EMA | 23.3 | 23.09 | 22.87 | | 50 day EMA | 21.72 | 21.51 | 21.3 |
SMA (simple moving average) of Comstock Resources CRK
| SMA period | SMA current | SMA prev | SMA prev2 | | 5 day SMA | 26.46 | 26.19 | 25.86 | | 12 day SMA | 25.45 | 25.27 | 25.15 | | 20 day SMA | 24.96 | 24.68 | 24.34 | | 35 day SMA | 22.09 | 21.87 | 21.66 | | 50 day SMA | 21.53 | 21.38 | 21.22 | | 100 day SMA | 19.46 | 19.42 | 19.4 | | 150 day SMA | 21.13 | 21.07 | 21.02 | | 200 day SMA | 20.59 | 20.56 | 20.52 |
|
|
