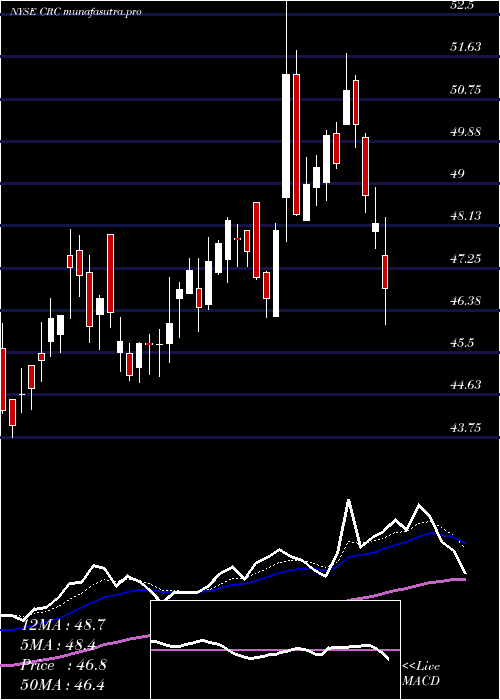
CaliforniaResources CRC full analysis,charts,indicators,moving averages,SMA,DMA,EMA,ADX,MACD,RSICalifornia Resources CRC WideScreen charts, DMA,SMA,EMA technical analysis, forecast prediction, by indicators ADX,MACD,RSI,CCI NYSE stock exchange
operates under Energy sector & deals in Oil Gas Production
Daily price and charts and targets CaliforniaResources Strong Daily Stock price targets for CaliforniaResources CRC are 47.57 and 48.33 | Daily Target 1 | 47.01 | | Daily Target 2 | 47.37 | | Daily Target 3 | 47.766666666667 | | Daily Target 4 | 48.13 | | Daily Target 5 | 48.53 |
Daily price and volume California Resources
| Date |
Closing |
Open |
Range |
Volume |
Thu 04 December 2025 |
47.74 (0%) |
47.53 |
47.40 - 48.16 |
0.7216 times |
Wed 03 December 2025 |
47.74 (0.65%) |
47.69 |
47.44 - 48.10 |
0.9883 times |
Tue 02 December 2025 |
47.43 (0.25%) |
47.73 |
46.54 - 47.94 |
0.79 times |
Mon 01 December 2025 |
47.31 (-0.98%) |
47.38 |
47.26 - 47.99 |
1.0256 times |
Fri 28 November 2025 |
47.78 (1.88%) |
46.70 |
46.69 - 47.83 |
0.7063 times |
Wed 26 November 2025 |
46.90 (1.16%) |
46.47 |
46.47 - 47.64 |
1.4681 times |
Tue 25 November 2025 |
46.36 (-0.58%) |
46.00 |
45.68 - 46.64 |
0.8354 times |
Mon 24 November 2025 |
46.63 (0.82%) |
45.79 |
45.39 - 46.81 |
0.7006 times |
Fri 21 November 2025 |
46.25 (0.28%) |
46.05 |
45.52 - 46.94 |
1.481 times |
Thu 20 November 2025 |
46.12 (-3.01%) |
47.71 |
46.00 - 49.03 |
1.2832 times |
Wed 19 November 2025 |
47.55 (-0.9%) |
46.90 |
46.40 - 47.62 |
0.9066 times |
Weekly price and charts CaliforniaResources Strong weekly Stock price targets for CaliforniaResources CRC are 47.14 and 48.76 | Weekly Target 1 | 45.86 | | Weekly Target 2 | 46.8 | | Weekly Target 3 | 47.48 | | Weekly Target 4 | 48.42 | | Weekly Target 5 | 49.1 |
Weekly price and volumes for California Resources
| Date |
Closing |
Open |
Range |
Volume |
Thu 04 December 2025 |
47.74 (-0.08%) |
47.38 |
46.54 - 48.16 |
0.7669 times |
Fri 28 November 2025 |
47.78 (3.31%) |
45.79 |
45.39 - 47.83 |
0.8071 times |
Fri 21 November 2025 |
46.25 (-5.28%) |
48.80 |
45.52 - 49.03 |
1.2629 times |
Fri 14 November 2025 |
48.83 (5.76%) |
46.27 |
45.60 - 49.55 |
1.4209 times |
Fri 07 November 2025 |
46.17 (-2.12%) |
46.27 |
45.11 - 49.19 |
1.1896 times |
Fri 31 October 2025 |
47.17 (0%) |
47.11 |
46.57 - 47.57 |
0.1731 times |
Fri 31 October 2025 |
47.17 (-0.84%) |
47.94 |
46.28 - 48.24 |
0.9108 times |
Fri 24 October 2025 |
47.57 (0.61%) |
47.17 |
46.28 - 49.11 |
0.9625 times |
Fri 17 October 2025 |
47.28 (-3.02%) |
49.91 |
46.20 - 50.12 |
1.0015 times |
Fri 10 October 2025 |
48.75 (-7.74%) |
53.32 |
48.71 - 53.88 |
1.5047 times |
Fri 03 October 2025 |
52.84 (-6.38%) |
56.03 |
51.89 - 56.31 |
1.0021 times |

Monthly price and charts CaliforniaResources Strong monthly Stock price targets for CaliforniaResources CRC are 47.14 and 48.76 | Monthly Target 1 | 45.86 | | Monthly Target 2 | 46.8 | | Monthly Target 3 | 47.48 | | Monthly Target 4 | 48.42 | | Monthly Target 5 | 49.1 |
Monthly price and volumes California Resources
| Date |
Closing |
Open |
Range |
Volume |
Thu 04 December 2025 |
47.74 (-0.08%) |
47.38 |
46.54 - 48.16 |
0.1538 times |
Fri 28 November 2025 |
47.78 (1.29%) |
46.27 |
45.11 - 49.55 |
0.9385 times |
Fri 31 October 2025 |
47.17 (-11.3%) |
52.64 |
46.20 - 54.26 |
1.0201 times |
Tue 30 September 2025 |
53.18 (7.05%) |
49.49 |
48.84 - 58.41 |
1.3361 times |
Fri 29 August 2025 |
49.68 (3.11%) |
47.52 |
46.09 - 51.89 |
0.8866 times |
Thu 31 July 2025 |
48.18 (5.5%) |
45.68 |
45.30 - 53.11 |
1.0918 times |
Mon 30 June 2025 |
45.67 (3.4%) |
45.54 |
43.75 - 48.05 |
1.0082 times |
Fri 30 May 2025 |
44.17 (27.99%) |
34.32 |
34.32 - 44.38 |
0.9857 times |
Wed 30 April 2025 |
34.51 (-21.51%) |
43.85 |
30.97 - 45.65 |
0.8615 times |
Mon 31 March 2025 |
43.97 (-1.46%) |
45.84 |
38.02 - 45.84 |
1.7177 times |
Fri 28 February 2025 |
44.62 (-9.31%) |
49.54 |
43.82 - 49.97 |
0.6568 times |

DMA SMA EMA moving averages of California Resources CRC
DMA (daily moving average) of California Resources CRC
| DMA period | DMA value | | 5 day DMA | 47.6 | | 12 day DMA | 47.15 | | 20 day DMA | 47.32 | | 35 day DMA | 47.22 | | 50 day DMA | 48.72 | | 100 day DMA | 49.53 | | 150 day DMA | 47.7 | | 200 day DMA | 45.75 | EMA (exponential moving average) of California Resources CRC
| EMA period | EMA current | EMA prev | EMA prev2 | | 5 day EMA | 47.52 | 47.41 | 47.25 | | 12 day EMA | 47.36 | 47.29 | 47.21 | | 20 day EMA | 47.48 | 47.45 | 47.42 | | 35 day EMA | 48.34 | 48.38 | 48.42 | | 50 day EMA | 49.18 | 49.24 | 49.3 |
SMA (simple moving average) of California Resources CRC
| SMA period | SMA current | SMA prev | SMA prev2 | | 5 day SMA | 47.6 | 47.43 | 47.16 | | 12 day SMA | 47.15 | 47.15 | 47.24 | | 20 day SMA | 47.32 | 47.25 | 47.2 | | 35 day SMA | 47.22 | 47.22 | 47.24 | | 50 day SMA | 48.72 | 48.89 | 49.04 | | 100 day SMA | 49.53 | 49.52 | 49.52 | | 150 day SMA | 47.7 | 47.62 | 47.53 | | 200 day SMA | 45.75 | 45.75 | 45.75 |
|
|
