CraneCo CR full analysis,charts,indicators,moving averages,SMA,DMA,EMA,ADX,MACD,RSICrane Co CR WideScreen charts, DMA,SMA,EMA technical analysis, forecast prediction, by indicators ADX,MACD,RSI,CCI NYSE stock exchange
operates under Capital Goods sector & deals in Metal Fabrications
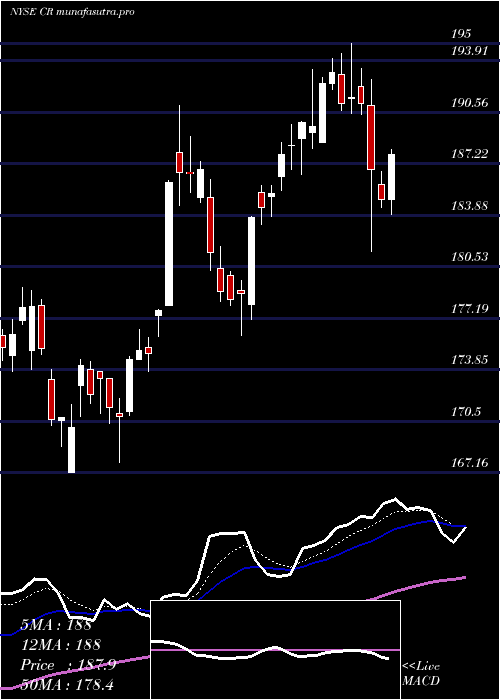
Daily price and charts and targets CraneCo Strong Daily Stock price targets for CraneCo CR are 186.46 and 190.81 | Daily Target 1 | 183.07 | | Daily Target 2 | 185.5 | | Daily Target 3 | 187.42 | | Daily Target 4 | 189.85 | | Daily Target 5 | 191.77 |
Daily price and volume Crane Co
| Date |
Closing |
Open |
Range |
Volume |
Thu 04 December 2025 |
187.93 (2.12%) |
186.20 |
184.99 - 189.34 |
0.917 times |
Wed 03 December 2025 |
184.03 (1.47%) |
182.37 |
179.46 - 184.90 |
1.1836 times |
Tue 02 December 2025 |
181.36 (0.55%) |
181.64 |
179.86 - 182.75 |
1.1191 times |
Mon 01 December 2025 |
180.37 (-1.57%) |
181.43 |
180.33 - 183.35 |
0.9868 times |
Fri 28 November 2025 |
183.25 (0.26%) |
183.47 |
180.97 - 183.72 |
0.3469 times |
Wed 26 November 2025 |
182.78 (-0.03%) |
182.50 |
181.88 - 184.32 |
1.092 times |
Tue 25 November 2025 |
182.83 (2.23%) |
179.89 |
178.92 - 183.53 |
1.175 times |
Mon 24 November 2025 |
178.84 (-0.03%) |
178.53 |
177.03 - 180.55 |
0.769 times |
Fri 21 November 2025 |
178.89 (1.55%) |
177.41 |
173.63 - 179.13 |
1.3929 times |
Thu 20 November 2025 |
176.16 (-1.69%) |
182.59 |
175.46 - 183.20 |
1.0179 times |
Wed 19 November 2025 |
179.18 (-0.17%) |
179.76 |
178.26 - 182.58 |
1.6097 times |
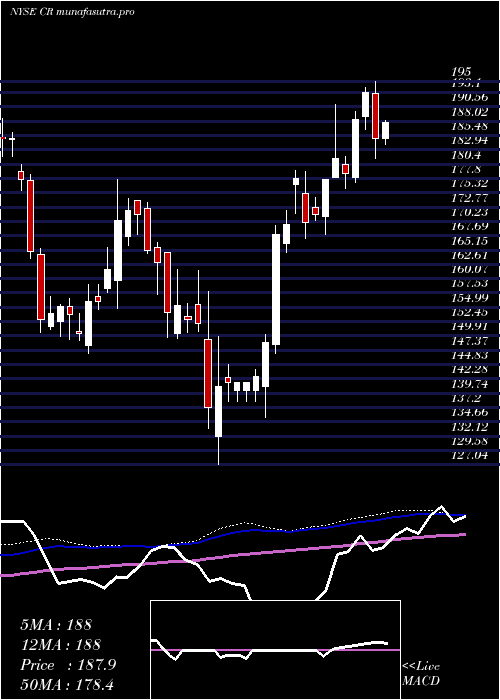
Weekly price and charts CraneCo Strong weekly Stock price targets for CraneCo CR are 183.7 and 193.58 | Weekly Target 1 | 175.7 | | Weekly Target 2 | 181.81 | | Weekly Target 3 | 185.57666666667 | | Weekly Target 4 | 191.69 | | Weekly Target 5 | 195.46 |
Weekly price and volumes for Crane Co
| Date |
Closing |
Open |
Range |
Volume |
Thu 04 December 2025 |
187.93 (2.55%) |
181.43 |
179.46 - 189.34 |
1.1691 times |
Fri 28 November 2025 |
183.25 (2.44%) |
178.53 |
177.03 - 184.32 |
0.9402 times |
Fri 21 November 2025 |
178.89 (-2.62%) |
183.98 |
173.63 - 184.98 |
1.5655 times |
Fri 14 November 2025 |
183.70 (-3.03%) |
191.53 |
175.63 - 192.15 |
0.945 times |
Fri 07 November 2025 |
189.44 (-0.29%) |
189.87 |
186.66 - 192.00 |
0.6289 times |
Fri 31 October 2025 |
190.00 (0%) |
192.07 |
188.30 - 193.04 |
0.236 times |
Fri 31 October 2025 |
190.00 (-0.92%) |
192.86 |
187.38 - 201.00 |
1.5038 times |
Fri 24 October 2025 |
191.76 (4.36%) |
185.00 |
184.56 - 194.40 |
1.1284 times |
Fri 17 October 2025 |
183.74 (4.98%) |
177.21 |
175.89 - 183.74 |
0.9531 times |
Fri 10 October 2025 |
175.03 (-2.72%) |
181.50 |
174.66 - 183.30 |
0.93 times |
Fri 03 October 2025 |
179.93 (-1.15%) |
183.25 |
178.05 - 184.39 |
0.7954 times |
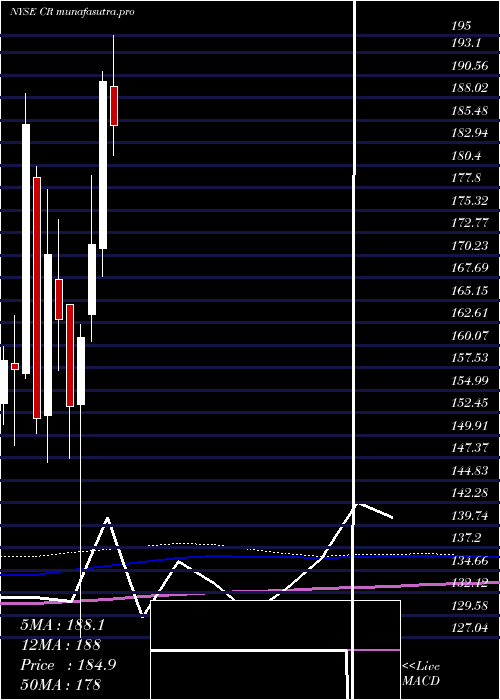
Monthly price and charts CraneCo Strong monthly Stock price targets for CraneCo CR are 183.7 and 193.58 | Monthly Target 1 | 175.7 | | Monthly Target 2 | 181.81 | | Monthly Target 3 | 185.57666666667 | | Monthly Target 4 | 191.69 | | Monthly Target 5 | 195.46 |
Monthly price and volumes Crane Co
| Date |
Closing |
Open |
Range |
Volume |
Thu 04 December 2025 |
187.93 (2.55%) |
181.43 |
179.46 - 189.34 |
0.2599 times |
Fri 28 November 2025 |
183.25 (-3.55%) |
189.87 |
173.63 - 192.15 |
0.9068 times |
Fri 31 October 2025 |
190.00 (3.18%) |
181.70 |
174.66 - 201.00 |
1.1647 times |
Tue 30 September 2025 |
184.14 (-0.63%) |
182.59 |
175.82 - 187.49 |
1.0844 times |
Fri 29 August 2025 |
185.30 (-5.35%) |
192.24 |
184.46 - 199.88 |
1.0144 times |
Thu 31 July 2025 |
195.77 (3.1%) |
189.23 |
181.48 - 203.89 |
0.9292 times |
Mon 30 June 2025 |
189.89 (10.79%) |
171.02 |
167.84 - 191.00 |
1.2123 times |
Fri 30 May 2025 |
171.40 (6.47%) |
163.53 |
160.49 - 179.20 |
0.8229 times |
Wed 30 April 2025 |
160.98 (5.09%) |
153.35 |
127.04 - 162.36 |
1.3792 times |
Mon 31 March 2025 |
153.18 (-6.02%) |
164.64 |
147.31 - 164.64 |
1.2263 times |
Fri 28 February 2025 |
162.99 (-4.3%) |
167.52 |
157.22 - 174.32 |
0.7203 times |
DMA SMA EMA moving averages of Crane Co CR
DMA (daily moving average) of Crane Co CR
| DMA period | DMA value | | 5 day DMA | 183.39 | | 12 day DMA | 181.26 | | 20 day DMA | 183.56 | | 35 day DMA | 185.95 | | 50 day DMA | 184.21 | | 100 day DMA | 186.52 | | 150 day DMA | 184.07 | | 200 day DMA | 175.91 | EMA (exponential moving average) of Crane Co CR
| EMA period | EMA current | EMA prev | EMA prev2 | | 5 day EMA | 184.15 | 182.26 | 181.38 | | 12 day EMA | 183.17 | 182.3 | 181.99 | | 20 day EMA | 183.55 | 183.09 | 182.99 | | 35 day EMA | 183.43 | 183.16 | 183.11 | | 50 day EMA | 183.95 | 183.79 | 183.78 |
SMA (simple moving average) of Crane Co CR
| SMA period | SMA current | SMA prev | SMA prev2 | | 5 day SMA | 183.39 | 182.36 | 182.12 | | 12 day SMA | 181.26 | 180.5 | 180.48 | | 20 day SMA | 183.56 | 183.72 | 183.92 | | 35 day SMA | 185.95 | 185.74 | 185.62 | | 50 day SMA | 184.21 | 184.03 | 183.98 | | 100 day SMA | 186.52 | 186.5 | 186.54 | | 150 day SMA | 184.07 | 183.89 | 183.72 | | 200 day SMA | 175.91 | 175.84 | 175.77 |
|
|
