CopaHoldings CPA full analysis,charts,indicators,moving averages,SMA,DMA,EMA,ADX,MACD,RSICopa Holdings CPA WideScreen charts, DMA,SMA,EMA technical analysis, forecast prediction, by indicators ADX,MACD,RSI,CCI NYSE stock exchange
operates under Transportation sector & deals in Air Freight Delivery Services
Daily price and charts and targets CopaHoldings Strong Daily Stock price targets for CopaHoldings CPA are 126.19 and 128.25 | Daily Target 1 | 124.49 | | Daily Target 2 | 125.82 | | Daily Target 3 | 126.55333333333 | | Daily Target 4 | 127.88 | | Daily Target 5 | 128.61 |
Daily price and volume Copa Holdings
| Date |
Closing |
Open |
Range |
Volume |
Mon 20 October 2025 |
127.14 (1.88%) |
125.69 |
125.23 - 127.29 |
0.5174 times |
Fri 17 October 2025 |
124.80 (-0.22%) |
125.07 |
124.01 - 126.50 |
0.614 times |
Thu 16 October 2025 |
125.07 (-1.87%) |
127.75 |
123.42 - 128.23 |
0.7066 times |
Wed 15 October 2025 |
127.45 (-0.48%) |
128.83 |
127.14 - 130.00 |
0.8883 times |
Tue 14 October 2025 |
128.07 (4.31%) |
121.99 |
121.73 - 130.00 |
2.099 times |
Mon 13 October 2025 |
122.78 (0.9%) |
122.07 |
122.07 - 123.70 |
0.7586 times |
Fri 10 October 2025 |
121.69 (-2.15%) |
125.45 |
121.36 - 127.09 |
1.9665 times |
Thu 09 October 2025 |
124.37 (-0.25%) |
126.65 |
122.48 - 127.00 |
0.9997 times |
Wed 08 October 2025 |
124.68 (3.43%) |
121.45 |
120.56 - 124.81 |
0.8813 times |
Tue 07 October 2025 |
120.55 (-0.36%) |
121.79 |
119.27 - 121.79 |
0.5686 times |
Mon 06 October 2025 |
120.98 (0.27%) |
121.39 |
120.24 - 121.77 |
0.498 times |
Weekly price and charts CopaHoldings Strong weekly Stock price targets for CopaHoldings CPA are 126.19 and 128.25 | Weekly Target 1 | 124.49 | | Weekly Target 2 | 125.82 | | Weekly Target 3 | 126.55333333333 | | Weekly Target 4 | 127.88 | | Weekly Target 5 | 128.61 |
Weekly price and volumes for Copa Holdings
| Date |
Closing |
Open |
Range |
Volume |
Mon 20 October 2025 |
127.14 (1.88%) |
125.69 |
125.23 - 127.29 |
0.1329 times |
Fri 17 October 2025 |
124.80 (2.56%) |
122.07 |
121.73 - 130.00 |
1.3014 times |
Fri 10 October 2025 |
121.69 (0.85%) |
121.39 |
119.27 - 127.09 |
1.2623 times |
Fri 03 October 2025 |
120.66 (2.58%) |
118.77 |
116.78 - 121.60 |
1.0873 times |
Fri 26 September 2025 |
117.63 (-1.77%) |
119.30 |
115.18 - 123.00 |
1.5038 times |
Fri 19 September 2025 |
119.75 (1.28%) |
118.25 |
114.95 - 120.00 |
0.9649 times |
Fri 12 September 2025 |
118.24 (0.36%) |
117.91 |
113.70 - 118.74 |
1.5779 times |
Fri 05 September 2025 |
117.82 (0.41%) |
115.31 |
114.05 - 119.33 |
0.9991 times |
Fri 29 August 2025 |
117.34 (0%) |
118.14 |
117.24 - 118.50 |
0.1935 times |
Fri 29 August 2025 |
117.34 (0.24%) |
117.06 |
116.00 - 120.27 |
0.9769 times |
Fri 22 August 2025 |
117.06 (-0.19%) |
117.02 |
113.33 - 117.89 |
1.713 times |
Monthly price and charts CopaHoldings Strong monthly Stock price targets for CopaHoldings CPA are 121.96 and 135.18 | Monthly Target 1 | 111.42 | | Monthly Target 2 | 119.28 | | Monthly Target 3 | 124.64 | | Monthly Target 4 | 132.5 | | Monthly Target 5 | 137.86 |
Monthly price and volumes Copa Holdings
| Date |
Closing |
Open |
Range |
Volume |
Mon 20 October 2025 |
127.14 (7%) |
118.82 |
116.78 - 130.00 |
0.5448 times |
Tue 30 September 2025 |
118.82 (1.26%) |
115.31 |
113.70 - 123.00 |
0.8833 times |
Fri 29 August 2025 |
117.34 (6.04%) |
110.19 |
107.78 - 121.63 |
1.1972 times |
Thu 31 July 2025 |
110.66 (0.63%) |
108.80 |
106.56 - 114.15 |
0.9229 times |
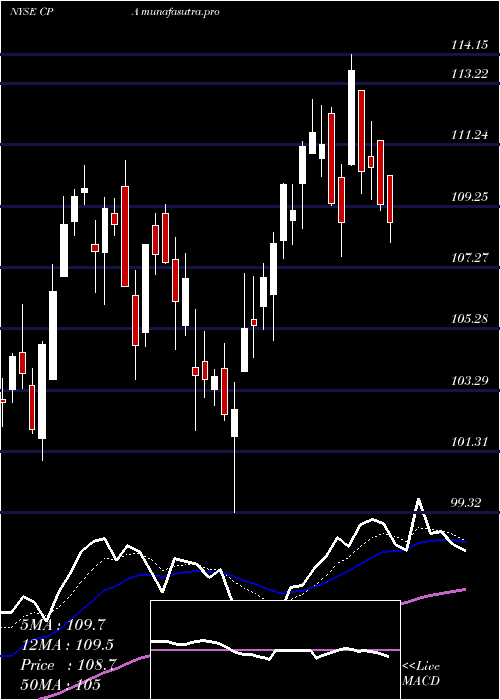
Mon 30 June 2025 |
109.97 (2.03%) |
107.74 |
99.32 - 110.73 |
1.0374 times |
Fri 30 May 2025 |
107.78 (17.46%) |
92.50 |
91.61 - 110.56 |
1.367 times |
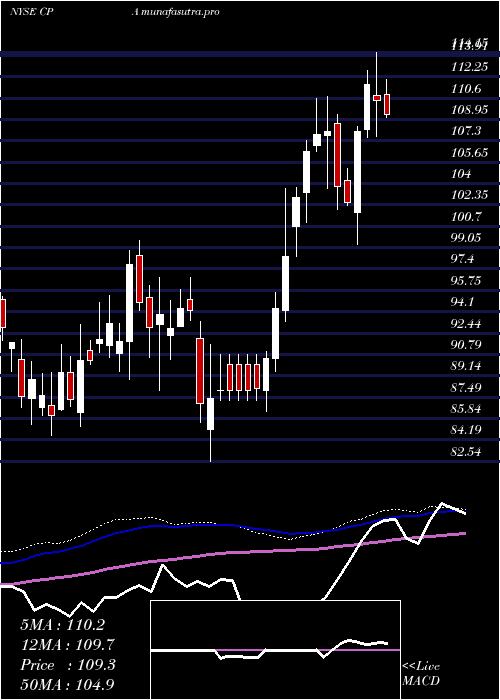
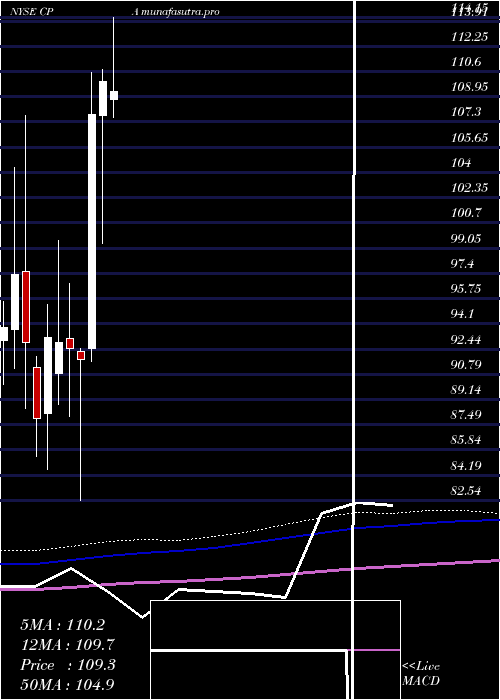
Wed 30 April 2025 |
91.76 (-0.76%) |
92.31 |
82.54 - 92.50 |
1.0049 times |
Mon 31 March 2025 |
92.46 (-0.45%) |
93.15 |
88.01 - 96.76 |
1.0218 times |
Fri 28 February 2025 |
92.88 (-0.36%) |
90.85 |
88.83 - 99.58 |
1.0062 times |
Fri 31 January 2025 |
93.22 (6.08%) |
88.25 |
84.58 - 95.36 |
1.0145 times |
Tue 31 December 2024 |
87.88 (-5.4%) |
91.26 |
85.38 - 91.97 |
0.9025 times |
DMA SMA EMA moving averages of Copa Holdings CPA
DMA (daily moving average) of Copa Holdings CPA
| DMA period | DMA value | | 5 day DMA | 126.51 | | 12 day DMA | 124.02 | | 20 day DMA | 122.03 | | 35 day DMA | 119.95 | | 50 day DMA | 119.1 | | 100 day DMA | 114.01 | | 150 day DMA | 107.28 | | 200 day DMA | 103.6 | EMA (exponential moving average) of Copa Holdings CPA
| EMA period | EMA current | EMA prev | EMA prev2 | | 5 day EMA | 125.79 | 125.11 | 125.26 | | 12 day EMA | 124.16 | 123.62 | 123.41 | | 20 day EMA | 122.73 | 122.27 | 122 | | 35 day EMA | 120.98 | 120.62 | 120.37 | | 50 day EMA | 119.46 | 119.15 | 118.92 |
SMA (simple moving average) of Copa Holdings CPA
| SMA period | SMA current | SMA prev | SMA prev2 | | 5 day SMA | 126.51 | 125.63 | 125.01 | | 12 day SMA | 124.02 | 123.42 | 122.82 | | 20 day SMA | 122.03 | 121.67 | 121.42 | | 35 day SMA | 119.95 | 119.67 | 119.46 | | 50 day SMA | 119.1 | 118.89 | 118.75 | | 100 day SMA | 114.01 | 113.82 | 113.64 | | 150 day SMA | 107.28 | 107.06 | 106.84 | | 200 day SMA | 103.6 | 103.39 | 103.2 |
|
|
