CotyInc COTY full analysis,charts,indicators,moving averages,SMA,DMA,EMA,ADX,MACD,RSICoty Inc COTY WideScreen charts, DMA,SMA,EMA technical analysis, forecast prediction, by indicators ADX,MACD,RSI,CCI NYSE stock exchange
operates under Consumer Non Durables sector & deals in Package Goods Cosmetics
Daily price and charts and targets CotyInc Strong Daily Stock price targets for CotyInc COTY are 4.13 and 4.24 | Daily Target 1 | 4.05 | | Daily Target 2 | 4.1 | | Daily Target 3 | 4.1566666666667 | | Daily Target 4 | 4.21 | | Daily Target 5 | 4.27 |
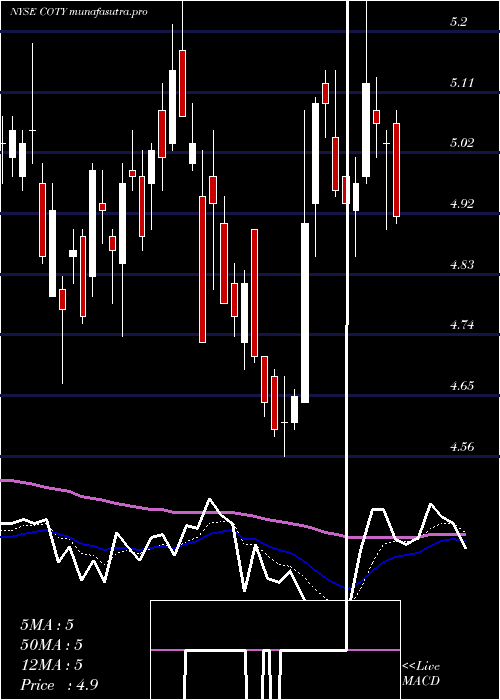
Daily price and volume Coty Inc
| Date |
Closing |
Open |
Range |
Volume |
Wed 22 October 2025 |
4.16 (0.48%) |
4.11 |
4.10 - 4.21 |
0.7011 times |
Tue 21 October 2025 |
4.14 (0.24%) |
4.11 |
4.10 - 4.22 |
0.9964 times |
Mon 20 October 2025 |
4.13 (-4.84%) |
4.33 |
4.12 - 4.34 |
0.8654 times |
Fri 17 October 2025 |
4.34 (4.58%) |
4.15 |
4.12 - 4.34 |
0.7004 times |
Thu 16 October 2025 |
4.15 (-2.12%) |
4.26 |
4.13 - 4.31 |
0.9606 times |
Wed 15 October 2025 |
4.24 (-1.62%) |
4.34 |
4.23 - 4.43 |
0.7221 times |
Tue 14 October 2025 |
4.31 (-0.46%) |
4.23 |
4.23 - 4.38 |
0.7534 times |
Mon 13 October 2025 |
4.33 (3.34%) |
4.25 |
4.25 - 4.38 |
1.2269 times |
Fri 10 October 2025 |
4.19 (-5.84%) |
4.46 |
4.15 - 4.47 |
1.6061 times |
Thu 09 October 2025 |
4.45 (3.25%) |
4.30 |
4.22 - 4.46 |
1.4677 times |
Wed 08 October 2025 |
4.31 (6.16%) |
4.08 |
4.06 - 4.33 |
1.3237 times |
Weekly price and charts CotyInc Strong weekly Stock price targets for CotyInc COTY are 4.01 and 4.25 | Weekly Target 1 | 3.96 | | Weekly Target 2 | 4.06 | | Weekly Target 3 | 4.2 | | Weekly Target 4 | 4.3 | | Weekly Target 5 | 4.44 |
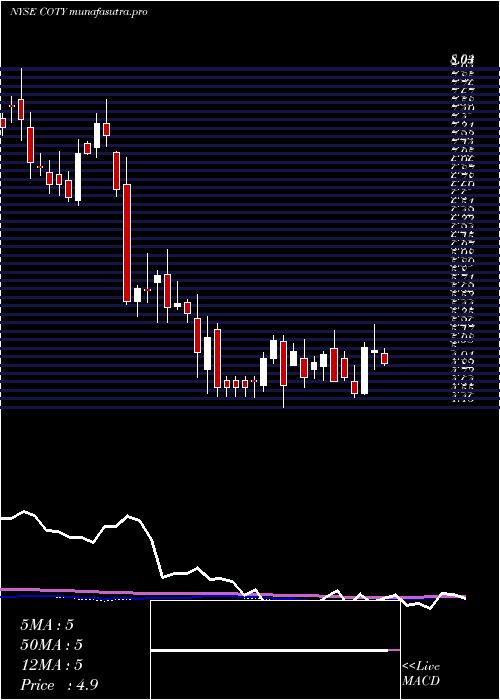
Weekly price and volumes for Coty Inc
| Date |
Closing |
Open |
Range |
Volume |
Wed 22 October 2025 |
4.16 (-4.15%) |
4.33 |
4.10 - 4.34 |
0.4504 times |
Fri 17 October 2025 |
4.34 (3.58%) |
4.25 |
4.12 - 4.43 |
0.7668 times |
Fri 10 October 2025 |
4.19 (4.49%) |
3.94 |
3.94 - 4.47 |
1.1353 times |
Fri 03 October 2025 |
4.01 (0%) |
4.03 |
3.89 - 4.17 |
0.7896 times |
Fri 26 September 2025 |
4.01 (-2.43%) |
4.06 |
3.90 - 4.13 |
0.7651 times |
Fri 19 September 2025 |
4.11 (0.49%) |
4.11 |
4.08 - 4.56 |
1.0994 times |
Fri 12 September 2025 |
4.09 (-6.41%) |
4.37 |
4.01 - 4.37 |
0.8723 times |
Fri 05 September 2025 |
4.37 (2.1%) |
4.23 |
4.17 - 4.53 |
1.0879 times |
Fri 29 August 2025 |
4.28 (0%) |
4.35 |
4.24 - 4.39 |
0.3772 times |
Fri 29 August 2025 |
4.28 (8.91%) |
4.03 |
3.67 - 4.39 |
2.6559 times |
Fri 22 August 2025 |
3.93 (-20.12%) |
4.95 |
3.75 - 5.03 |
3.0718 times |
Monthly price and charts CotyInc Strong monthly Stock price targets for CotyInc COTY are 4.03 and 4.61 | Monthly Target 1 | 3.59 | | Monthly Target 2 | 3.88 | | Monthly Target 3 | 4.1733333333333 | | Monthly Target 4 | 4.46 | | Monthly Target 5 | 4.75 |
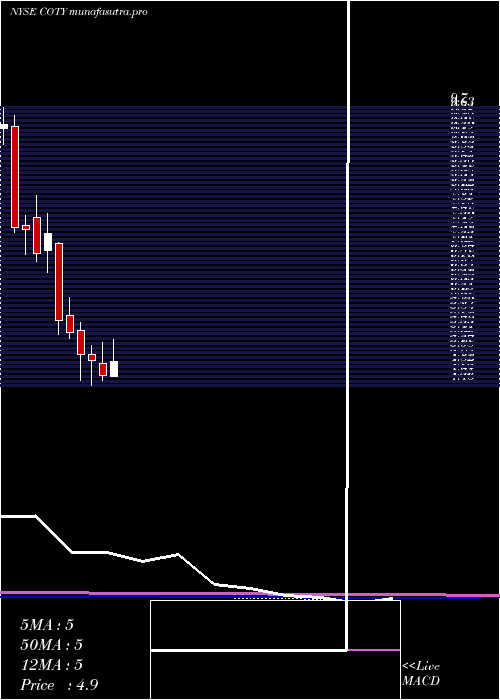
Monthly price and volumes Coty Inc
| Date |
Closing |
Open |
Range |
Volume |
Wed 22 October 2025 |
4.16 (2.97%) |
4.02 |
3.89 - 4.47 |
0.6093 times |
Tue 30 September 2025 |
4.04 (-5.61%) |
4.23 |
3.90 - 4.56 |
0.8952 times |
Fri 29 August 2025 |
4.28 (-11.75%) |
4.77 |
3.67 - 5.08 |
1.6639 times |
Thu 31 July 2025 |
4.85 (4.3%) |
4.64 |
4.64 - 5.33 |
1.0929 times |
Mon 30 June 2025 |
4.65 (-5.68%) |
4.89 |
4.56 - 5.27 |
1.0041 times |
Fri 30 May 2025 |
4.93 (-2.38%) |
5.05 |
4.46 - 5.22 |
1.1102 times |
Wed 30 April 2025 |
5.05 (-7.68%) |
5.50 |
4.56 - 5.65 |
1.0044 times |
Mon 31 March 2025 |
5.47 (-3.87%) |
5.78 |
5.35 - 6.13 |
0.7352 times |
Fri 28 February 2025 |
5.69 (-22.37%) |
7.15 |
5.42 - 7.16 |
1.1552 times |
Fri 31 January 2025 |
7.33 (5.32%) |
7.02 |
6.59 - 7.71 |
0.7296 times |
Tue 31 December 2024 |
6.96 (-6.07%) |
7.64 |
6.80 - 8.04 |
0.4246 times |
DMA SMA EMA moving averages of Coty Inc COTY
DMA (daily moving average) of Coty Inc COTY
| DMA period | DMA value | | 5 day DMA | 4.18 | | 12 day DMA | 4.23 | | 20 day DMA | 4.14 | | 35 day DMA | 4.15 | | 50 day DMA | 4.22 | | 100 day DMA | 4.57 | | 150 day DMA | 4.72 | | 200 day DMA | 5.13 | EMA (exponential moving average) of Coty Inc COTY
| EMA period | EMA current | EMA prev | EMA prev2 | | 5 day EMA | 4.18 | 4.19 | 4.22 | | 12 day EMA | 4.19 | 4.19 | 4.2 | | 20 day EMA | 4.19 | 4.19 | 4.19 | | 35 day EMA | 4.23 | 4.23 | 4.24 | | 50 day EMA | 4.26 | 4.26 | 4.26 |
SMA (simple moving average) of Coty Inc COTY
| SMA period | SMA current | SMA prev | SMA prev2 | | 5 day SMA | 4.18 | 4.2 | 4.23 | | 12 day SMA | 4.23 | 4.22 | 4.21 | | 20 day SMA | 4.14 | 4.13 | 4.12 | | 35 day SMA | 4.15 | 4.16 | 4.16 | | 50 day SMA | 4.22 | 4.24 | 4.25 | | 100 day SMA | 4.57 | 4.57 | 4.58 | | 150 day SMA | 4.72 | 4.73 | 4.74 | | 200 day SMA | 5.13 | 5.15 | 5.16 |
|
|
