AmericoldRealty COLD full analysis,charts,indicators,moving averages,SMA,DMA,EMA,ADX,MACD,RSIAmericold Realty COLD WideScreen charts, DMA,SMA,EMA technical analysis, forecast prediction, by indicators ADX,MACD,RSI,CCI NYSE stock exchange
operates under Consumer Services sector & deals in Real Estate Investment Trusts
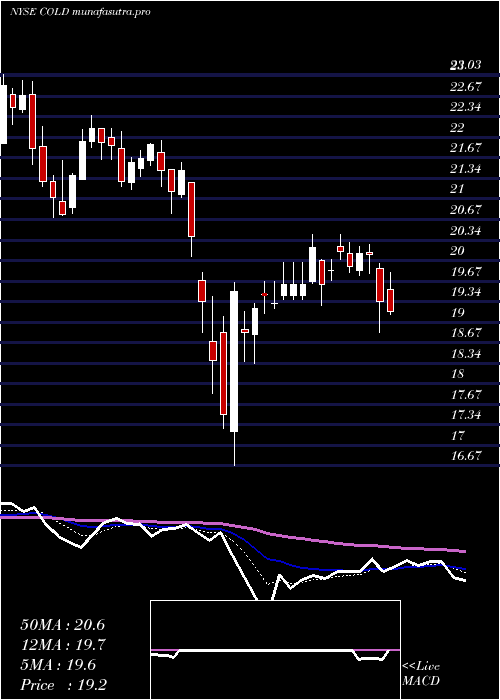
Daily price and charts and targets AmericoldRealty Strong Daily Stock price targets for AmericoldRealty COLD are 10.81 and 11.16 | Daily Target 1 | 10.71 | | Daily Target 2 | 10.91 | | Daily Target 3 | 11.056666666667 | | Daily Target 4 | 11.26 | | Daily Target 5 | 11.41 |
Daily price and volume Americold Realty
| Date |
Closing |
Open |
Range |
Volume |
Thu 04 December 2025 |
11.12 (0.36%) |
11.15 |
10.85 - 11.20 |
0.7607 times |
Wed 03 December 2025 |
11.08 (-0.36%) |
11.15 |
10.98 - 11.31 |
0.9006 times |
Tue 02 December 2025 |
11.12 (1.18%) |
11.02 |
10.95 - 11.33 |
1.3645 times |
Mon 01 December 2025 |
10.99 (1.48%) |
10.70 |
10.62 - 10.99 |
1.1589 times |
Fri 28 November 2025 |
10.83 (0.37%) |
10.79 |
10.73 - 10.93 |
0.3134 times |
Wed 26 November 2025 |
10.79 (2.27%) |
10.54 |
10.49 - 11.05 |
0.8638 times |
Tue 25 November 2025 |
10.55 (0.76%) |
10.53 |
10.40 - 10.71 |
0.6823 times |
Mon 24 November 2025 |
10.47 (0.87%) |
10.45 |
10.28 - 10.57 |
0.8247 times |
Fri 21 November 2025 |
10.38 (2.57%) |
10.12 |
10.10 - 10.64 |
2.1596 times |
Thu 20 November 2025 |
10.12 (-2.69%) |
10.41 |
10.12 - 10.64 |
0.9714 times |
Wed 19 November 2025 |
10.40 (-3.79%) |
10.76 |
10.26 - 10.96 |
1.5412 times |
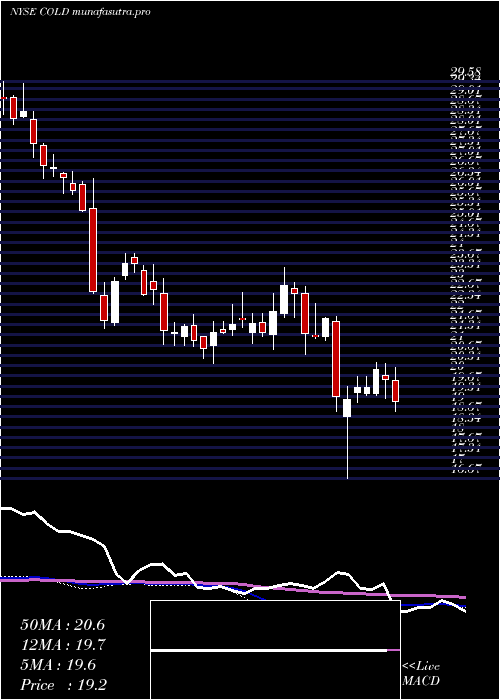
Weekly price and charts AmericoldRealty Strong weekly Stock price targets for AmericoldRealty COLD are 10.87 and 11.58 | Weekly Target 1 | 10.31 | | Weekly Target 2 | 10.72 | | Weekly Target 3 | 11.023333333333 | | Weekly Target 4 | 11.43 | | Weekly Target 5 | 11.73 |
Weekly price and volumes for Americold Realty
| Date |
Closing |
Open |
Range |
Volume |
Thu 04 December 2025 |
11.12 (2.68%) |
10.70 |
10.62 - 11.33 |
0.9602 times |
Fri 28 November 2025 |
10.83 (4.34%) |
10.45 |
10.28 - 11.05 |
0.6159 times |
Fri 21 November 2025 |
10.38 (-3.8%) |
10.76 |
10.10 - 11.15 |
1.4958 times |
Fri 14 November 2025 |
10.79 (-8.17%) |
11.77 |
10.50 - 11.81 |
1.4833 times |
Fri 07 November 2025 |
11.75 (-8.84%) |
12.74 |
11.46 - 12.80 |
1.0474 times |
Fri 31 October 2025 |
12.89 (0%) |
12.56 |
12.41 - 12.93 |
0.154 times |
Fri 31 October 2025 |
12.89 (-5.98%) |
13.81 |
12.35 - 14.10 |
1.0136 times |
Fri 24 October 2025 |
13.71 (0.51%) |
13.75 |
13.46 - 13.94 |
0.96 times |
Fri 17 October 2025 |
13.64 (1.41%) |
13.49 |
13.00 - 13.87 |
1.0337 times |
Fri 10 October 2025 |
13.45 (2.67%) |
13.39 |
13.15 - 13.73 |
1.2362 times |
Fri 03 October 2025 |
13.10 (7.91%) |
12.22 |
11.90 - 13.21 |
1.1818 times |
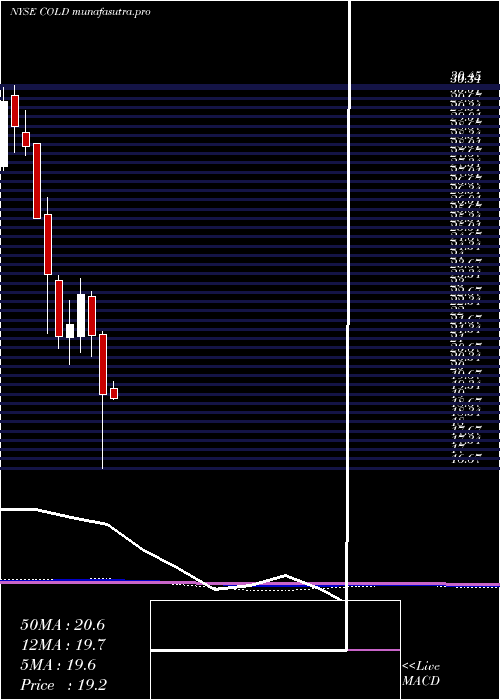
Monthly price and charts AmericoldRealty Strong monthly Stock price targets for AmericoldRealty COLD are 10.87 and 11.58 | Monthly Target 1 | 10.31 | | Monthly Target 2 | 10.72 | | Monthly Target 3 | 11.023333333333 | | Monthly Target 4 | 11.43 | | Monthly Target 5 | 11.73 |
Monthly price and volumes Americold Realty
| Date |
Closing |
Open |
Range |
Volume |
Thu 04 December 2025 |
11.12 (2.68%) |
10.70 |
10.62 - 11.33 |
0.3237 times |
Fri 28 November 2025 |
10.83 (-15.98%) |
12.74 |
10.10 - 12.80 |
1.5649 times |
Fri 31 October 2025 |
12.89 (5.31%) |
12.29 |
12.05 - 14.10 |
1.7086 times |
Tue 30 September 2025 |
12.24 (-15.24%) |
14.41 |
11.90 - 14.44 |
1.6585 times |
Fri 29 August 2025 |
14.44 (-10.2%) |
16.10 |
14.23 - 16.46 |
1.1808 times |
Thu 31 July 2025 |
16.08 (-3.31%) |
16.65 |
15.99 - 17.12 |
0.8042 times |
Mon 30 June 2025 |
16.63 (0.36%) |
16.47 |
16.11 - 18.08 |
0.6901 times |
Fri 30 May 2025 |
16.57 (-14.32%) |
19.53 |
16.29 - 19.81 |
0.9742 times |
Wed 30 April 2025 |
19.34 (-9.88%) |
21.48 |
16.67 - 21.59 |
0.6 times |
Mon 31 March 2025 |
21.46 (-6.41%) |
22.86 |
20.70 - 23.03 |
0.4951 times |
Fri 28 February 2025 |
22.93 (4.94%) |
21.42 |
20.85 - 23.52 |
0.7 times |
DMA SMA EMA moving averages of Americold Realty COLD
DMA (daily moving average) of Americold Realty COLD
| DMA period | DMA value | | 5 day DMA | 11.03 | | 12 day DMA | 10.72 | | 20 day DMA | 10.92 | | 35 day DMA | 11.93 | | 50 day DMA | 12.24 | | 100 day DMA | 13.5 | | 150 day DMA | 14.73 | | 200 day DMA | 16.28 | EMA (exponential moving average) of Americold Realty COLD
| EMA period | EMA current | EMA prev | EMA prev2 | | 5 day EMA | 11.01 | 10.95 | 10.89 | | 12 day EMA | 10.97 | 10.94 | 10.92 | | 20 day EMA | 11.16 | 11.16 | 11.17 | | 35 day EMA | 11.58 | 11.61 | 11.64 | | 50 day EMA | 12.16 | 12.2 | 12.25 |
SMA (simple moving average) of Americold Realty COLD
| SMA period | SMA current | SMA prev | SMA prev2 | | 5 day SMA | 11.03 | 10.96 | 10.86 | | 12 day SMA | 10.72 | 10.7 | 10.68 | | 20 day SMA | 10.92 | 11 | 11.07 | | 35 day SMA | 11.93 | 12 | 12.07 | | 50 day SMA | 12.24 | 12.26 | 12.3 | | 100 day SMA | 13.5 | 13.55 | 13.6 | | 150 day SMA | 14.73 | 14.78 | 14.84 | | 200 day SMA | 16.28 | 16.33 | 16.38 |
|
|
