CapitalOne COF-K full analysis,charts,indicators,moving averages,SMA,DMA,EMA,ADX,MACD,RSICapital One COF-K WideScreen charts, DMA,SMA,EMA technical analysis, forecast prediction, by indicators ADX,MACD,RSI,CCI NYSE stock exchange
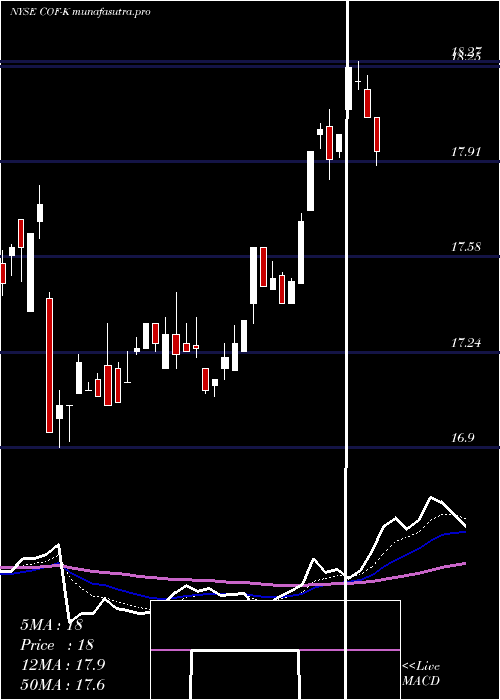
Daily price and charts and targets CapitalOne Strong Daily Stock price targets for CapitalOne COF-K are 17.32 and 17.42 | Daily Target 1 | 17.3 | | Daily Target 2 | 17.34 | | Daily Target 3 | 17.396666666667 | | Daily Target 4 | 17.44 | | Daily Target 5 | 17.5 |
Daily price and volume Capital One
| Date |
Closing |
Open |
Range |
Volume |
Fri 05 December 2025 |
17.39 (-0.51%) |
17.44 |
17.35 - 17.45 |
1.5114 times |
Thu 04 December 2025 |
17.48 (-0.46%) |
17.56 |
17.37 - 17.56 |
0.7381 times |
Wed 03 December 2025 |
17.56 (0.46%) |
17.46 |
17.45 - 17.56 |
1.0808 times |
Tue 02 December 2025 |
17.48 (-0.68%) |
17.65 |
17.44 - 17.65 |
0.9402 times |
Mon 01 December 2025 |
17.60 (-0.56%) |
17.69 |
17.58 - 17.71 |
1.0193 times |
Fri 28 November 2025 |
17.70 (0.34%) |
17.70 |
17.70 - 17.74 |
0.2109 times |
Wed 26 November 2025 |
17.64 (0.74%) |
17.53 |
17.53 - 17.71 |
1.2302 times |
Tue 25 November 2025 |
17.51 (0%) |
17.54 |
17.46 - 17.64 |
1.529 times |
Mon 24 November 2025 |
17.51 (0.63%) |
17.51 |
17.47 - 17.57 |
0.4921 times |
Fri 21 November 2025 |
17.40 (0.12%) |
17.34 |
17.33 - 17.53 |
1.2478 times |
Thu 20 November 2025 |
17.38 (-0.4%) |
17.51 |
17.30 - 17.54 |
1.5114 times |
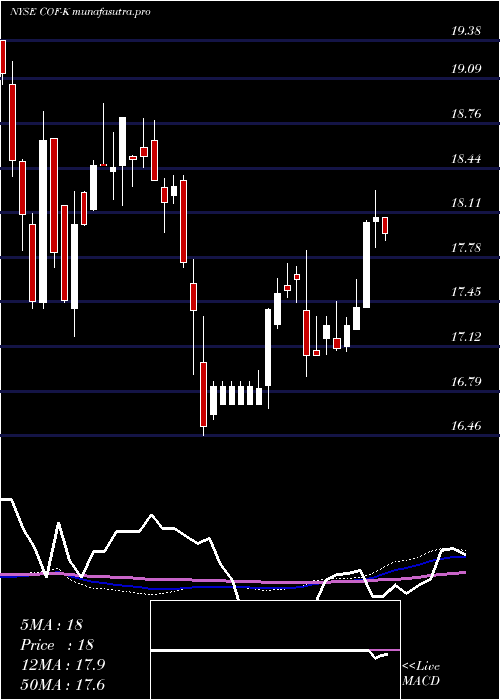
Weekly price and charts CapitalOne Strong weekly Stock price targets for CapitalOne COF-K are 17.19 and 17.55 | Weekly Target 1 | 17.12 | | Weekly Target 2 | 17.26 | | Weekly Target 3 | 17.483333333333 | | Weekly Target 4 | 17.62 | | Weekly Target 5 | 17.84 |
Weekly price and volumes for Capital One
| Date |
Closing |
Open |
Range |
Volume |
Fri 05 December 2025 |
17.39 (-1.75%) |
17.69 |
17.35 - 17.71 |
1.5484 times |
Fri 28 November 2025 |
17.70 (1.72%) |
17.51 |
17.46 - 17.74 |
1.0134 times |
Fri 21 November 2025 |
17.40 (-4.08%) |
17.91 |
17.30 - 17.93 |
1.2963 times |
Fri 14 November 2025 |
18.14 (-0.87%) |
18.36 |
18.07 - 18.56 |
0.9825 times |
Fri 07 November 2025 |
18.30 (-0.44%) |
18.24 |
18.13 - 18.45 |
0.7665 times |
Fri 31 October 2025 |
18.38 (0%) |
18.56 |
18.29 - 18.56 |
0.6147 times |
Fri 31 October 2025 |
18.38 (-2.7%) |
18.83 |
18.29 - 18.95 |
1.8184 times |
Fri 24 October 2025 |
18.89 (0.91%) |
18.80 |
18.72 - 19.05 |
0.6533 times |
Fri 17 October 2025 |
18.72 (1.08%) |
18.67 |
18.50 - 18.82 |
0.4707 times |
Fri 10 October 2025 |
18.52 (-2.22%) |
18.86 |
18.48 - 18.98 |
0.8359 times |
Fri 03 October 2025 |
18.94 (0.05%) |
19.05 |
18.64 - 19.13 |
1.0159 times |
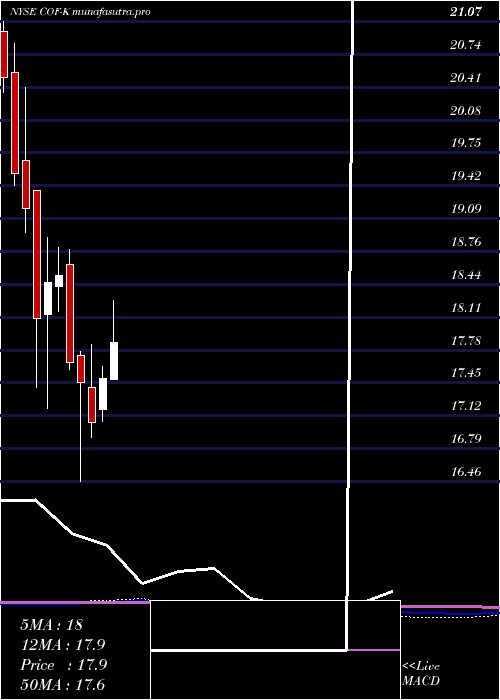
Monthly price and charts CapitalOne Strong monthly Stock price targets for CapitalOne COF-K are 17.19 and 17.55 | Monthly Target 1 | 17.12 | | Monthly Target 2 | 17.26 | | Monthly Target 3 | 17.483333333333 | | Monthly Target 4 | 17.62 | | Monthly Target 5 | 17.84 |
Monthly price and volumes Capital One
| Date |
Closing |
Open |
Range |
Volume |
Fri 05 December 2025 |
17.39 (-1.75%) |
17.69 |
17.35 - 17.71 |
0.3611 times |
Fri 28 November 2025 |
17.70 (-3.7%) |
18.24 |
17.30 - 18.56 |
0.9466 times |
Fri 31 October 2025 |
18.38 (-1.71%) |
18.69 |
18.29 - 19.13 |
1.1932 times |
Tue 30 September 2025 |
18.70 (1.91%) |
18.28 |
18.23 - 19.68 |
0.994 times |
Fri 29 August 2025 |
18.35 (1.44%) |
18.09 |
18.04 - 18.50 |
0.8164 times |
Thu 31 July 2025 |
18.09 (3.43%) |
17.48 |
17.48 - 18.27 |
1.0438 times |
Mon 30 June 2025 |
17.49 (2.58%) |
17.18 |
17.06 - 17.61 |
1.2357 times |
Fri 30 May 2025 |
17.05 (-2.29%) |
17.40 |
16.90 - 17.83 |
1.132 times |
Wed 30 April 2025 |
17.45 (-1.13%) |
17.72 |
16.46 - 17.76 |
1.2392 times |
Mon 31 March 2025 |
17.65 (-4.7%) |
18.64 |
17.58 - 18.79 |
1.0379 times |
Fri 28 February 2025 |
18.52 (0.38%) |
18.41 |
18.16 - 18.81 |
1.6089 times |
DMA SMA EMA moving averages of Capital One COF-K
DMA (daily moving average) of Capital One COF-K
| DMA period | DMA value | | 5 day DMA | 17.5 | | 12 day DMA | 17.51 | | 20 day DMA | 17.76 | | 35 day DMA | 18.14 | | 50 day DMA | 18.34 | | 100 day DMA | 18.42 | | 150 day DMA | 18.11 | | 200 day DMA | 18 | EMA (exponential moving average) of Capital One COF-K
| EMA period | EMA current | EMA prev | EMA prev2 | | 5 day EMA | 17.49 | 17.54 | 17.57 | | 12 day EMA | 17.58 | 17.62 | 17.65 | | 20 day EMA | 17.77 | 17.81 | 17.84 | | 35 day EMA | 18.03 | 18.07 | 18.1 | | 50 day EMA | 18.33 | 18.37 | 18.41 |
SMA (simple moving average) of Capital One COF-K
| SMA period | SMA current | SMA prev | SMA prev2 | | 5 day SMA | 17.5 | 17.56 | 17.6 | | 12 day SMA | 17.51 | 17.52 | 17.52 | | 20 day SMA | 17.76 | 17.8 | 17.85 | | 35 day SMA | 18.14 | 18.17 | 18.21 | | 50 day SMA | 18.34 | 18.38 | 18.41 | | 100 day SMA | 18.42 | 18.43 | 18.43 | | 150 day SMA | 18.11 | 18.11 | 18.11 | | 200 day SMA | 18 | 18.01 | 18.01 |
|
|
