CapitalOne COF full analysis,charts,indicators,moving averages,SMA,DMA,EMA,ADX,MACD,RSICapital One COF WideScreen charts, DMA,SMA,EMA technical analysis, forecast prediction, by indicators ADX,MACD,RSI,CCI NYSE stock exchange
operates under Finance sector & deals in Major Banks
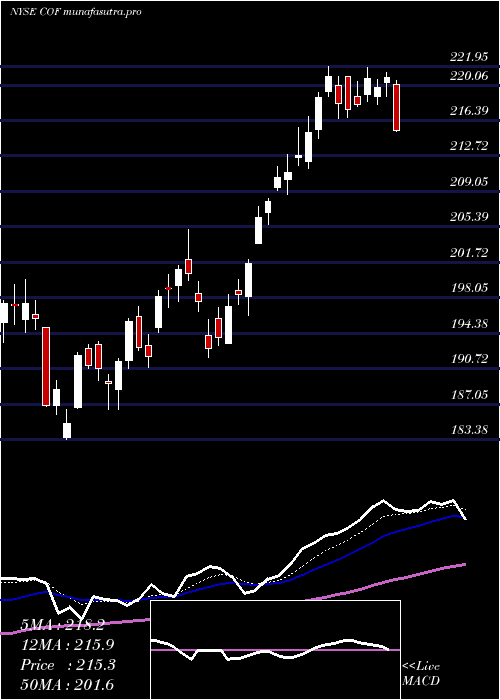
Daily price and charts and targets CapitalOne Strong Daily Stock price targets for CapitalOne COF are 227.1 and 231.86 | Daily Target 1 | 225.89 | | Daily Target 2 | 228.3 | | Daily Target 3 | 230.65333333333 | | Daily Target 4 | 233.06 | | Daily Target 5 | 235.41 |
Daily price and volume Capital One
| Date |
Closing |
Open |
Range |
Volume |
Fri 05 December 2025 |
230.70 (0.43%) |
230.99 |
228.25 - 233.01 |
0.6601 times |
Thu 04 December 2025 |
229.71 (1.09%) |
226.80 |
226.48 - 230.96 |
1.5158 times |
Wed 03 December 2025 |
227.24 (1.48%) |
223.93 |
222.98 - 228.41 |
1.4436 times |
Tue 02 December 2025 |
223.93 (1.62%) |
221.50 |
219.87 - 224.89 |
0.6372 times |
Mon 01 December 2025 |
220.37 (0.59%) |
218.15 |
217.56 - 223.03 |
1.2086 times |
Fri 28 November 2025 |
219.07 (0.74%) |
218.73 |
217.55 - 220.80 |
0.5788 times |
Wed 26 November 2025 |
217.47 (1.41%) |
214.60 |
214.50 - 219.15 |
0.8582 times |
Tue 25 November 2025 |
214.45 (2.68%) |
208.98 |
208.13 - 215.68 |
1.0184 times |
Mon 24 November 2025 |
208.86 (0.48%) |
207.95 |
206.41 - 210.53 |
0.4472 times |
Fri 21 November 2025 |
207.87 (2.79%) |
203.46 |
201.90 - 209.43 |
1.6322 times |
Thu 20 November 2025 |
202.22 (-0.09%) |
206.38 |
201.16 - 209.95 |
1.9695 times |
Weekly price and charts CapitalOne Strong weekly Stock price targets for CapitalOne COF are 224.13 and 239.58 | Weekly Target 1 | 211.64 | | Weekly Target 2 | 221.17 | | Weekly Target 3 | 227.09 | | Weekly Target 4 | 236.62 | | Weekly Target 5 | 242.54 |
Weekly price and volumes for Capital One
| Date |
Closing |
Open |
Range |
Volume |
Fri 05 December 2025 |
230.70 (5.31%) |
218.15 |
217.56 - 233.01 |
1.1193 times |
Fri 28 November 2025 |
219.07 (5.39%) |
207.95 |
206.41 - 220.80 |
0.5945 times |
Fri 21 November 2025 |
207.87 (-1.55%) |
209.81 |
199.09 - 210.58 |
1.752 times |
Fri 14 November 2025 |
211.15 (-3.06%) |
219.11 |
209.63 - 223.57 |
1.1571 times |
Fri 07 November 2025 |
217.82 (-0.99%) |
219.26 |
213.30 - 223.43 |
0.9389 times |
Fri 31 October 2025 |
219.99 (0%) |
218.00 |
217.19 - 221.11 |
0.1844 times |
Fri 31 October 2025 |
219.99 (-2.22%) |
227.42 |
217.09 - 227.59 |
1.0986 times |
Fri 24 October 2025 |
224.98 (6.45%) |
213.00 |
212.03 - 230.80 |
1.2505 times |
Fri 17 October 2025 |
211.34 (-1.1%) |
205.25 |
200.60 - 218.00 |
1.61 times |
Tue 07 October 2025 |
213.69 (-0.33%) |
215.52 |
211.13 - 217.21 |
0.2947 times |
Fri 03 October 2025 |
214.40 (-4.31%) |
226.23 |
208.72 - 226.23 |
1.6324 times |
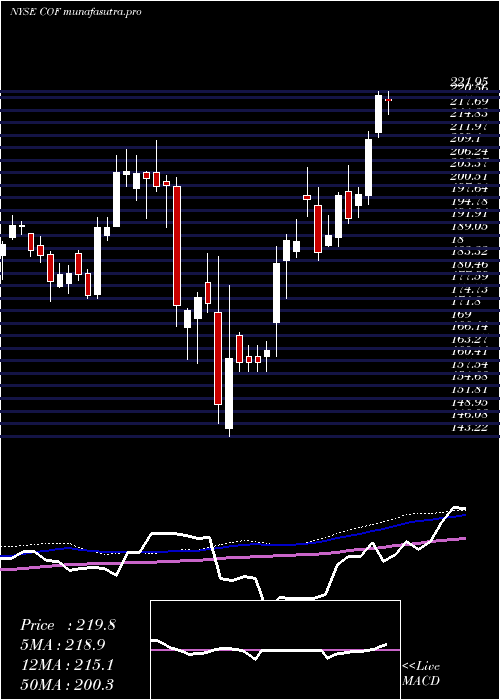
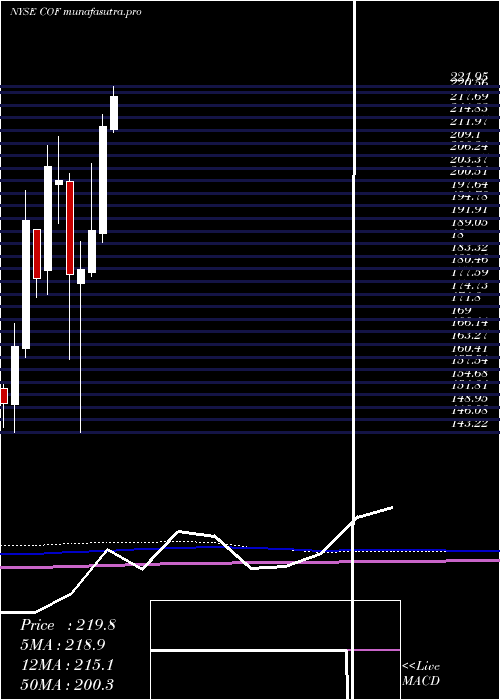
Monthly price and charts CapitalOne Strong monthly Stock price targets for CapitalOne COF are 224.13 and 239.58 | Monthly Target 1 | 211.64 | | Monthly Target 2 | 221.17 | | Monthly Target 3 | 227.09 | | Monthly Target 4 | 236.62 | | Monthly Target 5 | 242.54 |
Monthly price and volumes Capital One
| Date |
Closing |
Open |
Range |
Volume |
Fri 05 December 2025 |
230.70 (5.31%) |
218.15 |
217.56 - 233.01 |
0.1981 times |
Fri 28 November 2025 |
219.07 (-0.42%) |
219.26 |
199.09 - 223.57 |
0.7861 times |
Fri 31 October 2025 |
219.99 (3.49%) |
213.31 |
200.60 - 230.80 |
0.9071 times |
Tue 30 September 2025 |
212.58 (-6.44%) |
223.40 |
208.72 - 230.50 |
0.8916 times |
Fri 29 August 2025 |
227.22 (5.68%) |
211.57 |
203.63 - 228.16 |
0.8731 times |
Thu 31 July 2025 |
215.00 (1.05%) |
212.14 |
208.81 - 232.45 |
1.109 times |
Mon 30 June 2025 |
212.76 (12.48%) |
188.60 |
186.51 - 215.62 |
0.9412 times |
Fri 30 May 2025 |
189.15 (4.93%) |
179.74 |
178.66 - 204.48 |
1.5689 times |
Wed 30 April 2025 |
180.26 (0.54%) |
177.18 |
143.22 - 186.63 |
1.4395 times |
Mon 31 March 2025 |
179.30 (-10.6%) |
200.30 |
159.91 - 202.25 |
1.2855 times |
Fri 28 February 2025 |
200.55 (-1.55%) |
199.74 |
190.90 - 210.67 |
0.8152 times |
DMA SMA EMA moving averages of Capital One COF
DMA (daily moving average) of Capital One COF
| DMA period | DMA value | | 5 day DMA | 226.39 | | 12 day DMA | 217.02 | | 20 day DMA | 215.72 | | 35 day DMA | 217.24 | | 50 day DMA | 216.85 | | 100 day DMA | 217.91 | | 150 day DMA | 211.46 | | 200 day DMA | 202.73 | EMA (exponential moving average) of Capital One COF
| EMA period | EMA current | EMA prev | EMA prev2 | | 5 day EMA | 226.47 | 224.36 | 221.68 | | 12 day EMA | 220.9 | 219.12 | 217.19 | | 20 day EMA | 218.76 | 217.5 | 216.21 | | 35 day EMA | 217.77 | 217.01 | 216.26 | | 50 day EMA | 218.65 | 218.16 | 217.69 |
SMA (simple moving average) of Capital One COF
| SMA period | SMA current | SMA prev | SMA prev2 | | 5 day SMA | 226.39 | 224.06 | 221.62 | | 12 day SMA | 217.02 | 214.48 | 212.08 | | 20 day SMA | 215.72 | 215.03 | 214.61 | | 35 day SMA | 217.24 | 216.45 | 216.04 | | 50 day SMA | 216.85 | 216.75 | 216.72 | | 100 day SMA | 217.91 | 217.8 | 217.71 | | 150 day SMA | 211.46 | 211.15 | 210.83 | | 200 day SMA | 202.73 | 202.57 | 202.4 |
|
|
