CornerstoneBuilding CNR full analysis,charts,indicators,moving averages,SMA,DMA,EMA,ADX,MACD,RSICornerstone Building CNR WideScreen charts, DMA,SMA,EMA technical analysis, forecast prediction, by indicators ADX,MACD,RSI,CCI NYSE stock exchange
Daily price and charts and targets CornerstoneBuilding Strong Daily Stock price targets for CornerstoneBuilding CNR are 82.71 and 85.59 | Daily Target 1 | 80.34 | | Daily Target 2 | 82.19 | | Daily Target 3 | 83.22 | | Daily Target 4 | 85.07 | | Daily Target 5 | 86.1 |
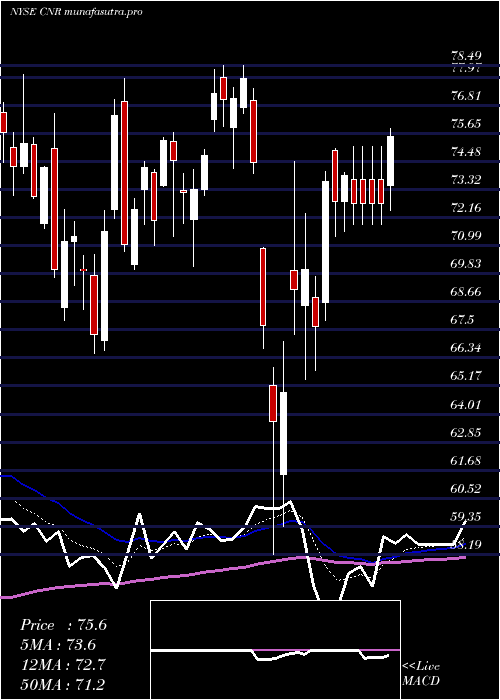
Daily price and volume Cornerstone Building
| Date |
Closing |
Open |
Range |
Volume |
Thu 04 December 2025 |
84.04 (1.64%) |
82.00 |
81.37 - 84.25 |
0.5863 times |
Wed 03 December 2025 |
82.68 (6.26%) |
77.85 |
77.37 - 83.33 |
1.2584 times |
Tue 02 December 2025 |
77.81 (0.63%) |
77.00 |
76.72 - 80.35 |
0.7935 times |
Mon 01 December 2025 |
77.32 (-3.35%) |
79.91 |
77.08 - 80.56 |
0.9308 times |
Fri 28 November 2025 |
80.00 (2.09%) |
78.61 |
77.98 - 80.08 |
0.3068 times |
Wed 26 November 2025 |
78.36 (0.51%) |
76.89 |
76.89 - 80.39 |
1.2529 times |
Tue 25 November 2025 |
77.96 (1.15%) |
76.88 |
76.74 - 79.50 |
0.6996 times |
Mon 24 November 2025 |
77.07 (-0.84%) |
76.32 |
75.54 - 77.84 |
0.7351 times |
Fri 21 November 2025 |
77.72 (1.52%) |
77.34 |
74.75 - 78.06 |
1.795 times |
Thu 20 November 2025 |
76.56 (-1.92%) |
78.92 |
76.50 - 80.03 |
1.6417 times |
Wed 19 November 2025 |
78.06 (-2.9%) |
80.01 |
77.91 - 80.80 |
0.8301 times |
Weekly price and charts CornerstoneBuilding Strong weekly Stock price targets for CornerstoneBuilding CNR are 80.38 and 87.91 | Weekly Target 1 | 74.14 | | Weekly Target 2 | 79.09 | | Weekly Target 3 | 81.67 | | Weekly Target 4 | 86.62 | | Weekly Target 5 | 89.2 |
Weekly price and volumes for Cornerstone Building
| Date |
Closing |
Open |
Range |
Volume |
Thu 04 December 2025 |
84.04 (5.05%) |
79.91 |
76.72 - 84.25 |
0.7265 times |
Fri 28 November 2025 |
80.00 (2.93%) |
76.32 |
75.54 - 80.39 |
0.6096 times |
Fri 21 November 2025 |
77.72 (-5.65%) |
82.03 |
74.75 - 83.28 |
1.1865 times |
Fri 14 November 2025 |
82.37 (-7.87%) |
89.04 |
80.84 - 91.36 |
0.8507 times |
Fri 07 November 2025 |
89.41 (13.18%) |
79.91 |
75.00 - 90.13 |
1.2409 times |
Fri 31 October 2025 |
79.00 (0%) |
76.40 |
75.50 - 79.10 |
0.2179 times |
Fri 31 October 2025 |
79.00 (-4.89%) |
82.96 |
75.49 - 83.97 |
0.9412 times |
Fri 24 October 2025 |
83.06 (-7.53%) |
91.12 |
82.39 - 93.07 |
0.9262 times |
Fri 17 October 2025 |
89.82 (-6.9%) |
97.08 |
88.51 - 102.49 |
1.4806 times |
Fri 10 October 2025 |
96.48 (8.61%) |
90.25 |
88.03 - 102.93 |
1.82 times |
Fri 03 October 2025 |
88.83 (7.28%) |
82.58 |
81.43 - 90.45 |
0.8236 times |

Monthly price and charts CornerstoneBuilding Strong monthly Stock price targets for CornerstoneBuilding CNR are 80.38 and 87.91 | Monthly Target 1 | 74.14 | | Monthly Target 2 | 79.09 | | Monthly Target 3 | 81.67 | | Monthly Target 4 | 86.62 | | Monthly Target 5 | 89.2 |
Monthly price and volumes Cornerstone Building
| Date |
Closing |
Open |
Range |
Volume |
Thu 04 December 2025 |
84.04 (5.05%) |
79.91 |
76.72 - 84.25 |
0.182 times |
Fri 28 November 2025 |
80.00 (1.27%) |
79.91 |
74.75 - 91.36 |
0.9736 times |
Fri 31 October 2025 |
79.00 (-5.37%) |
83.69 |
75.49 - 102.93 |
1.4675 times |
Tue 30 September 2025 |
83.48 (12.42%) |
73.23 |
70.36 - 85.44 |
0.8401 times |
Fri 29 August 2025 |
74.26 (0.61%) |
73.00 |
68.78 - 80.44 |
0.9247 times |
Thu 31 July 2025 |
73.81 (5.84%) |
68.78 |
64.57 - 85.72 |
1.1375 times |
Mon 30 June 2025 |
69.74 (0.63%) |
70.04 |
64.15 - 75.78 |
1.1178 times |
Fri 30 May 2025 |
69.30 (-4.03%) |
73.29 |
63.36 - 76.18 |
1.1539 times |
Wed 30 April 2025 |
72.21 (-6.34%) |
76.75 |
58.19 - 78.49 |
1.0497 times |
Mon 31 March 2025 |
77.10 (3.84%) |
75.05 |
66.54 - 78.46 |
1.1532 times |
Fri 28 February 2025 |
74.25 (-17.81%) |
88.70 |
71.70 - 91.22 |
1.2396 times |

DMA SMA EMA moving averages of Cornerstone Building CNR
DMA (daily moving average) of Cornerstone Building CNR
| DMA period | DMA value | | 5 day DMA | 80.37 | | 12 day DMA | 79 | | 20 day DMA | 81.61 | | 35 day DMA | 82.04 | | 50 day DMA | 84.6 | | 100 day DMA | 79.72 | | 150 day DMA | 76.73 | | 200 day DMA | 75.85 | EMA (exponential moving average) of Cornerstone Building CNR
| EMA period | EMA current | EMA prev | EMA prev2 | | 5 day EMA | 81.11 | 79.65 | 78.14 | | 12 day EMA | 80.33 | 79.65 | 79.1 | | 20 day EMA | 80.74 | 80.39 | 80.15 | | 35 day EMA | 82.27 | 82.17 | 82.14 | | 50 day EMA | 83.63 | 83.61 | 83.65 |
SMA (simple moving average) of Cornerstone Building CNR
| SMA period | SMA current | SMA prev | SMA prev2 | | 5 day SMA | 80.37 | 79.23 | 78.29 | | 12 day SMA | 79 | 78.63 | 78.6 | | 20 day SMA | 81.61 | 81.29 | 80.99 | | 35 day SMA | 82.04 | 82.26 | 82.75 | | 50 day SMA | 84.6 | 84.58 | 84.47 | | 100 day SMA | 79.72 | 79.61 | 79.54 | | 150 day SMA | 76.73 | 76.65 | 76.6 | | 200 day SMA | 75.85 | 75.82 | 75.81 |
|
|
