CenterpointEnergy CNP full analysis,charts,indicators,moving averages,SMA,DMA,EMA,ADX,MACD,RSICenterpoint Energy CNP WideScreen charts, DMA,SMA,EMA technical analysis, forecast prediction, by indicators ADX,MACD,RSI,CCI NYSE stock exchange
operates under Public Utilities sector & deals in Electric Utilities Central
Daily price and charts and targets CenterpointEnergy Strong Daily Stock price targets for CenterpointEnergy CNP are 38.21 and 38.6 | Daily Target 1 | 38.13 | | Daily Target 2 | 38.28 | | Daily Target 3 | 38.52 | | Daily Target 4 | 38.67 | | Daily Target 5 | 38.91 |
Daily price and volume Centerpoint Energy
| Date |
Closing |
Open |
Range |
Volume |
Fri 05 December 2025 |
38.43 (-0.29%) |
38.50 |
38.37 - 38.76 |
1.0818 times |
Thu 04 December 2025 |
38.54 (0.42%) |
38.80 |
38.29 - 38.86 |
1.5139 times |
Wed 03 December 2025 |
38.38 (0.08%) |
38.39 |
38.07 - 38.56 |
1.0026 times |
Tue 02 December 2025 |
38.35 (-1.99%) |
39.28 |
38.33 - 39.32 |
1.4006 times |
Mon 01 December 2025 |
39.13 (-2.13%) |
39.87 |
39.10 - 39.94 |
0.9694 times |
Fri 28 November 2025 |
39.98 (0.08%) |
39.95 |
39.89 - 40.13 |
0.3506 times |
Wed 26 November 2025 |
39.95 (1.37%) |
39.48 |
39.48 - 39.99 |
0.6571 times |
Tue 25 November 2025 |
39.41 (-0.78%) |
39.77 |
39.27 - 39.93 |
1.0185 times |
Mon 24 November 2025 |
39.72 (0.4%) |
39.56 |
39.14 - 39.81 |
0.6317 times |
Fri 21 November 2025 |
39.56 (-0.08%) |
39.72 |
39.47 - 39.90 |
1.3739 times |
Thu 20 November 2025 |
39.59 (-0.05%) |
39.60 |
39.46 - 39.99 |
2.0229 times |
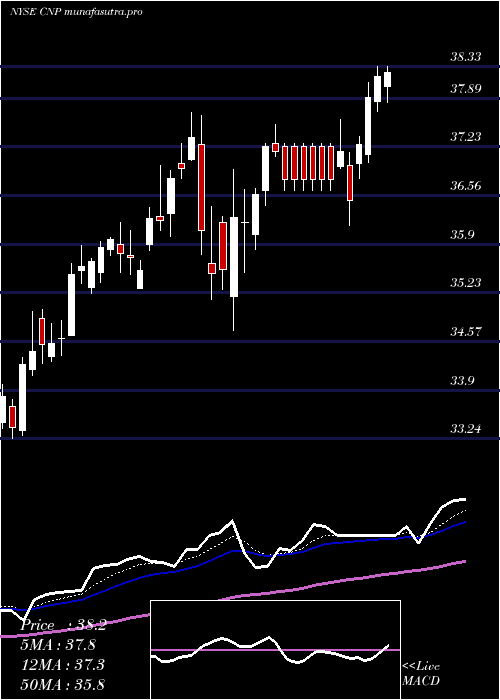
Weekly price and charts CenterpointEnergy Strong weekly Stock price targets for CenterpointEnergy CNP are 37.32 and 39.19 | Weekly Target 1 | 36.94 | | Weekly Target 2 | 37.69 | | Weekly Target 3 | 38.813333333333 | | Weekly Target 4 | 39.56 | | Weekly Target 5 | 40.68 |
Weekly price and volumes for Centerpoint Energy
| Date |
Closing |
Open |
Range |
Volume |
Fri 05 December 2025 |
38.43 (-3.88%) |
39.87 |
38.07 - 39.94 |
1.2732 times |
Fri 28 November 2025 |
39.98 (1.06%) |
39.56 |
39.14 - 40.13 |
0.567 times |
Fri 21 November 2025 |
39.56 (-0.45%) |
39.89 |
39.46 - 40.39 |
1.4613 times |
Fri 14 November 2025 |
39.74 (0.84%) |
39.18 |
39.15 - 39.93 |
1.0111 times |
Fri 07 November 2025 |
39.41 (3.06%) |
38.61 |
38.27 - 39.46 |
1.0426 times |
Fri 31 October 2025 |
38.24 (0%) |
38.68 |
38.24 - 38.77 |
0.3095 times |
Fri 31 October 2025 |
38.24 (-3.26%) |
39.65 |
38.24 - 39.90 |
1.3161 times |
Fri 24 October 2025 |
39.53 (-0.28%) |
39.79 |
39.31 - 40.49 |
1.3345 times |
Fri 17 October 2025 |
39.64 (0.53%) |
39.11 |
38.94 - 40.17 |
1.2281 times |
Tue 07 October 2025 |
39.43 (1.47%) |
38.93 |
38.77 - 39.68 |
0.4566 times |
Fri 03 October 2025 |
38.86 (0.13%) |
38.84 |
38.02 - 40.50 |
2.0317 times |
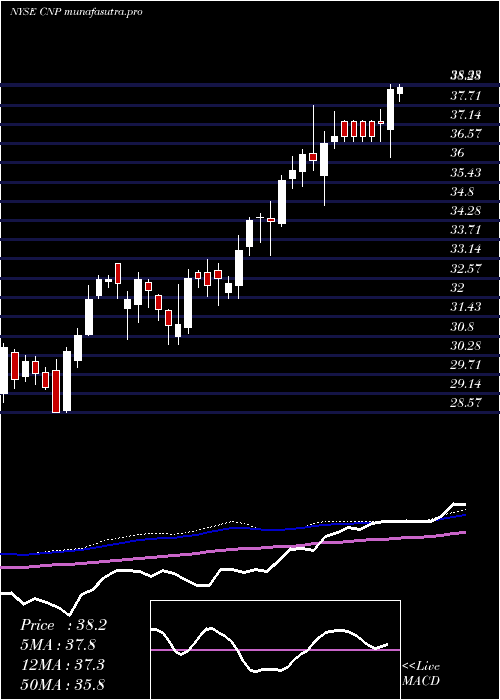
Monthly price and charts CenterpointEnergy Strong monthly Stock price targets for CenterpointEnergy CNP are 37.32 and 39.19 | Monthly Target 1 | 36.94 | | Monthly Target 2 | 37.69 | | Monthly Target 3 | 38.813333333333 | | Monthly Target 4 | 39.56 | | Monthly Target 5 | 40.68 |
Monthly price and volumes Centerpoint Energy
| Date |
Closing |
Open |
Range |
Volume |
Fri 05 December 2025 |
38.43 (-3.88%) |
39.87 |
38.07 - 39.94 |
0.2405 times |
Fri 28 November 2025 |
39.98 (4.55%) |
38.61 |
38.27 - 40.39 |
0.7712 times |
Fri 31 October 2025 |
38.24 (-1.44%) |
38.93 |
38.02 - 40.49 |
1.0582 times |
Tue 30 September 2025 |
38.80 (2.89%) |
37.65 |
36.61 - 40.50 |
1.2003 times |
Fri 29 August 2025 |
37.71 (-2.86%) |
38.95 |
37.39 - 39.39 |
0.907 times |
Thu 31 July 2025 |
38.82 (5.66%) |
36.53 |
35.46 - 38.98 |
1.2961 times |
Mon 30 June 2025 |
36.74 (-1.34%) |
37.08 |
35.52 - 37.56 |
1.013 times |
Fri 30 May 2025 |
37.24 (-3.97%) |
38.70 |
36.00 - 39.31 |
1.1893 times |
Wed 30 April 2025 |
38.78 (7.04%) |
36.32 |
34.72 - 38.86 |
1.3385 times |
Mon 31 March 2025 |
36.23 (5.38%) |
34.35 |
33.24 - 36.97 |
0.9858 times |
Fri 28 February 2025 |
34.38 (5.56%) |
32.16 |
31.96 - 34.49 |
0.8574 times |

DMA SMA EMA moving averages of Centerpoint Energy CNP
DMA (daily moving average) of Centerpoint Energy CNP
| DMA period | DMA value | | 5 day DMA | 38.57 | | 12 day DMA | 39.22 | | 20 day DMA | 39.42 | | 35 day DMA | 39.36 | | 50 day DMA | 39.26 | | 100 day DMA | 38.57 | | 150 day DMA | 38.04 | | 200 day DMA | 37.46 | EMA (exponential moving average) of Centerpoint Energy CNP
| EMA period | EMA current | EMA prev | EMA prev2 | | 5 day EMA | 38.66 | 38.78 | 38.9 | | 12 day EMA | 39.03 | 39.14 | 39.25 | | 20 day EMA | 39.16 | 39.24 | 39.31 | | 35 day EMA | 39.19 | 39.23 | 39.27 | | 50 day EMA | 39.09 | 39.12 | 39.14 |
SMA (simple moving average) of Centerpoint Energy CNP
| SMA period | SMA current | SMA prev | SMA prev2 | | 5 day SMA | 38.57 | 38.88 | 39.16 | | 12 day SMA | 39.22 | 39.35 | 39.49 | | 20 day SMA | 39.42 | 39.44 | 39.46 | | 35 day SMA | 39.36 | 39.39 | 39.43 | | 50 day SMA | 39.26 | 39.25 | 39.24 | | 100 day SMA | 38.57 | 38.55 | 38.53 | | 150 day SMA | 38.04 | 38.04 | 38.04 | | 200 day SMA | 37.46 | 37.44 | 37.42 |
|
|
