CanadianNational CNI full analysis,charts,indicators,moving averages,SMA,DMA,EMA,ADX,MACD,RSICanadian National CNI WideScreen charts, DMA,SMA,EMA technical analysis, forecast prediction, by indicators ADX,MACD,RSI,CCI NYSE stock exchange
operates under Transportation sector & deals in Railroads
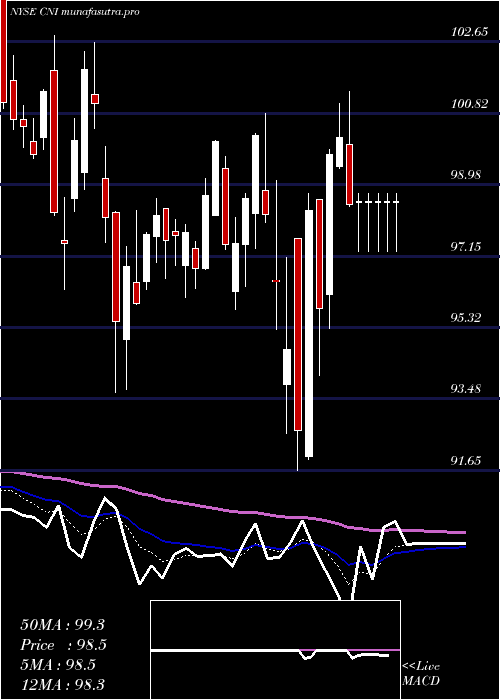
Daily price and charts and targets CanadianNational Strong Daily Stock price targets for CanadianNational CNI are 98.32 and 99.53 | Daily Target 1 | 97.43 | | Daily Target 2 | 97.99 | | Daily Target 3 | 98.636666666667 | | Daily Target 4 | 99.2 | | Daily Target 5 | 99.85 |
Daily price and volume Canadian National
| Date |
Closing |
Open |
Range |
Volume |
Thu 04 December 2025 |
98.56 (-0.07%) |
98.54 |
98.07 - 99.28 |
1.0219 times |
Wed 03 December 2025 |
98.63 (2.73%) |
96.49 |
96.44 - 99.14 |
0.9544 times |
Tue 02 December 2025 |
96.01 (0.48%) |
96.00 |
94.60 - 96.44 |
0.4375 times |
Mon 01 December 2025 |
95.55 (-0.35%) |
95.74 |
95.14 - 97.03 |
0.9975 times |
Fri 28 November 2025 |
95.89 (2%) |
95.30 |
94.87 - 96.18 |
0.4875 times |
Wed 26 November 2025 |
94.01 (1.45%) |
92.46 |
92.46 - 94.32 |
1.1067 times |
Tue 25 November 2025 |
92.67 (1.94%) |
91.46 |
91.41 - 92.68 |
0.9806 times |
Mon 24 November 2025 |
90.91 (-2.24%) |
93.00 |
90.74 - 93.00 |
1.5097 times |
Fri 21 November 2025 |
92.99 (1.05%) |
92.74 |
92.30 - 93.43 |
1.3352 times |
Thu 20 November 2025 |
92.02 (-1.65%) |
93.79 |
92.02 - 94.34 |
1.1689 times |
Wed 19 November 2025 |
93.56 (-0.43%) |
93.96 |
92.89 - 93.96 |
0.9622 times |
Weekly price and charts CanadianNational Strong weekly Stock price targets for CanadianNational CNI are 96.58 and 101.26 | Weekly Target 1 | 92.8 | | Weekly Target 2 | 95.68 | | Weekly Target 3 | 97.48 | | Weekly Target 4 | 100.36 | | Weekly Target 5 | 102.16 |
Weekly price and volumes for Canadian National
| Date |
Closing |
Open |
Range |
Volume |
Thu 04 December 2025 |
98.56 (2.78%) |
95.74 |
94.60 - 99.28 |
0.7408 times |
Fri 28 November 2025 |
95.89 (3.12%) |
93.00 |
90.74 - 96.18 |
0.887 times |
Fri 21 November 2025 |
92.99 (-3.29%) |
95.74 |
92.02 - 96.54 |
1.2191 times |
Fri 14 November 2025 |
96.15 (1.18%) |
95.25 |
94.46 - 98.18 |
0.8914 times |
Fri 07 November 2025 |
95.03 (-0.92%) |
95.38 |
93.41 - 96.51 |
0.9796 times |
Fri 31 October 2025 |
95.91 (0%) |
96.96 |
95.56 - 99.55 |
0.5936 times |
Fri 31 October 2025 |
95.91 (0.62%) |
95.72 |
92.71 - 99.55 |
1.3136 times |
Fri 24 October 2025 |
95.32 (-0.38%) |
96.16 |
94.77 - 97.57 |
0.9486 times |
Fri 17 October 2025 |
95.68 (1.3%) |
95.01 |
94.13 - 97.55 |
1.3242 times |
Fri 10 October 2025 |
94.45 (-2%) |
96.38 |
94.21 - 97.29 |
1.102 times |
Fri 03 October 2025 |
96.38 (3.77%) |
93.15 |
92.93 - 96.40 |
1.052 times |
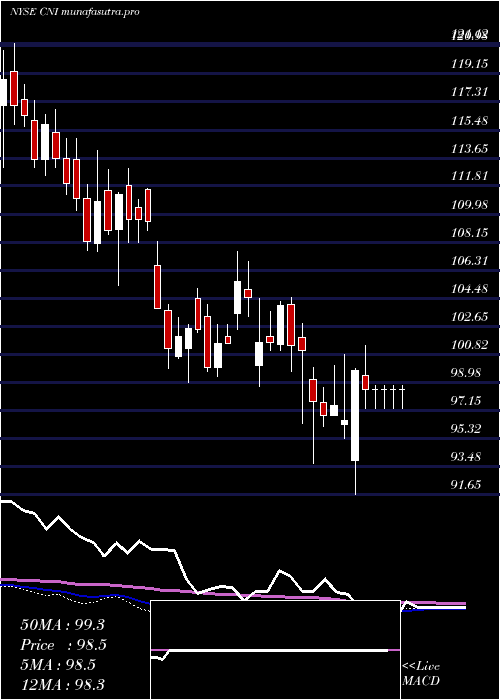
Monthly price and charts CanadianNational Strong monthly Stock price targets for CanadianNational CNI are 96.58 and 101.26 | Monthly Target 1 | 92.8 | | Monthly Target 2 | 95.68 | | Monthly Target 3 | 97.48 | | Monthly Target 4 | 100.36 | | Monthly Target 5 | 102.16 |
Monthly price and volumes Canadian National
| Date |
Closing |
Open |
Range |
Volume |
Thu 04 December 2025 |
98.56 (2.78%) |
95.74 |
94.60 - 99.28 |
0.1541 times |
Fri 28 November 2025 |
95.89 (-0.02%) |
95.38 |
90.74 - 98.18 |
0.8274 times |
Fri 31 October 2025 |
95.91 (1.71%) |
94.28 |
92.71 - 99.55 |
1.2189 times |
Tue 30 September 2025 |
94.30 (-2.56%) |
96.30 |
91.07 - 97.89 |
1.318 times |
Fri 29 August 2025 |
96.78 (3.56%) |
93.32 |
92.04 - 97.50 |
1.1999 times |
Thu 31 July 2025 |
93.45 (-10.18%) |
103.97 |
93.19 - 107.18 |
1.2978 times |
Mon 30 June 2025 |
104.04 (-0.86%) |
104.90 |
100.90 - 106.83 |
1 times |
Fri 30 May 2025 |
104.94 (8.39%) |
96.76 |
95.35 - 108.75 |
0.979 times |
Wed 30 April 2025 |
96.82 (-0.66%) |
97.44 |
91.65 - 101.36 |
1.004 times |
Mon 31 March 2025 |
97.46 (-3.85%) |
101.91 |
93.64 - 102.80 |
1.0008 times |
Fri 28 February 2025 |
101.36 (-3.01%) |
100.10 |
98.69 - 104.51 |
0.9533 times |

DMA SMA EMA moving averages of Canadian National CNI
DMA (daily moving average) of Canadian National CNI
| DMA period | DMA value | | 5 day DMA | 96.93 | | 12 day DMA | 94.56 | | 20 day DMA | 95.05 | | 35 day DMA | 95.1 | | 50 day DMA | 95.12 | | 100 day DMA | 95.12 | | 150 day DMA | 98.1 | | 200 day DMA | 98.19 | EMA (exponential moving average) of Canadian National CNI
| EMA period | EMA current | EMA prev | EMA prev2 | | 5 day EMA | 97.01 | 96.23 | 95.03 | | 12 day EMA | 95.71 | 95.19 | 94.57 | | 20 day EMA | 95.33 | 94.99 | 94.61 | | 35 day EMA | 95.08 | 94.87 | 94.65 | | 50 day EMA | 95.12 | 94.98 | 94.83 |
SMA (simple moving average) of Canadian National CNI
| SMA period | SMA current | SMA prev | SMA prev2 | | 5 day SMA | 96.93 | 96.02 | 94.83 | | 12 day SMA | 94.56 | 94.31 | 94.1 | | 20 day SMA | 95.05 | 94.92 | 94.78 | | 35 day SMA | 95.1 | 95.06 | 94.98 | | 50 day SMA | 95.12 | 95 | 94.87 | | 100 day SMA | 95.12 | 95.17 | 95.22 | | 150 day SMA | 98.1 | 98.09 | 98.08 | | 200 day SMA | 98.19 | 98.21 | 98.23 |
|
|
