CompassMinerals CMP full analysis,charts,indicators,moving averages,SMA,DMA,EMA,ADX,MACD,RSICompass Minerals CMP WideScreen charts, DMA,SMA,EMA technical analysis, forecast prediction, by indicators ADX,MACD,RSI,CCI NYSE stock exchange
operates under Basic Industries sector & deals in Mining Quarrying Of Nonmetallic Minerals No Fuels
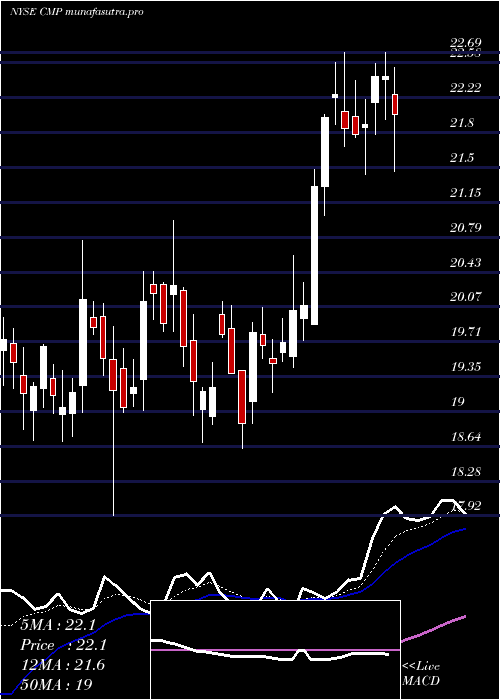
Daily price and charts and targets CompassMinerals Strong Daily Stock price targets for CompassMinerals CMP are 20.03 and 20.89 | Daily Target 1 | 19.37 | | Daily Target 2 | 19.83 | | Daily Target 3 | 20.233333333333 | | Daily Target 4 | 20.69 | | Daily Target 5 | 21.09 |
Daily price and volume Compass Minerals
| Date |
Closing |
Open |
Range |
Volume |
Fri 05 December 2025 |
20.28 (0.8%) |
20.08 |
19.78 - 20.64 |
1.1761 times |
Thu 04 December 2025 |
20.12 (1.72%) |
19.57 |
19.39 - 20.34 |
1.2091 times |
Wed 03 December 2025 |
19.78 (5.66%) |
18.89 |
18.73 - 19.90 |
1.3711 times |
Tue 02 December 2025 |
18.72 (-1.84%) |
19.12 |
18.56 - 19.25 |
0.6124 times |
Mon 01 December 2025 |
19.07 (0.42%) |
18.94 |
18.75 - 19.30 |
0.9757 times |
Fri 28 November 2025 |
18.99 (2.87%) |
18.67 |
18.56 - 19.00 |
0.6258 times |
Wed 26 November 2025 |
18.46 (0%) |
18.40 |
18.40 - 18.80 |
0.8875 times |
Tue 25 November 2025 |
18.46 (3.59%) |
17.94 |
17.82 - 18.52 |
0.7913 times |
Mon 24 November 2025 |
17.82 (0.45%) |
17.68 |
17.55 - 17.98 |
1.2602 times |
Fri 21 November 2025 |
17.74 (4.23%) |
17.00 |
16.96 - 17.93 |
1.0908 times |
Thu 20 November 2025 |
17.02 (-0.87%) |
17.33 |
16.76 - 17.53 |
1.0751 times |
Weekly price and charts CompassMinerals Strong weekly Stock price targets for CompassMinerals CMP are 19.42 and 21.5 | Weekly Target 1 | 17.75 | | Weekly Target 2 | 19.01 | | Weekly Target 3 | 19.826666666667 | | Weekly Target 4 | 21.09 | | Weekly Target 5 | 21.91 |
Weekly price and volumes for Compass Minerals
| Date |
Closing |
Open |
Range |
Volume |
Fri 05 December 2025 |
20.28 (6.79%) |
18.94 |
18.56 - 20.64 |
1.088 times |
Fri 28 November 2025 |
18.99 (7.05%) |
17.68 |
17.55 - 19.00 |
0.7257 times |
Fri 21 November 2025 |
17.74 (-0.22%) |
17.80 |
16.76 - 17.95 |
0.97 times |
Fri 14 November 2025 |
17.78 (3.55%) |
17.37 |
17.18 - 18.84 |
1.4111 times |
Fri 07 November 2025 |
17.17 (-0.98%) |
16.81 |
16.40 - 17.32 |
0.9608 times |
Fri 31 October 2025 |
17.34 (0%) |
17.09 |
16.68 - 17.40 |
0.1969 times |
Fri 31 October 2025 |
17.34 (-6.62%) |
18.37 |
16.68 - 18.37 |
1.1762 times |
Fri 24 October 2025 |
18.57 (1.87%) |
18.52 |
17.54 - 18.91 |
1.1314 times |
Fri 17 October 2025 |
18.23 (-0.44%) |
18.69 |
17.76 - 20.30 |
1.1489 times |
Fri 10 October 2025 |
18.31 (-2.61%) |
19.06 |
18.21 - 19.78 |
1.1909 times |
Fri 03 October 2025 |
18.80 (-3.29%) |
19.59 |
18.73 - 20.39 |
1.3444 times |
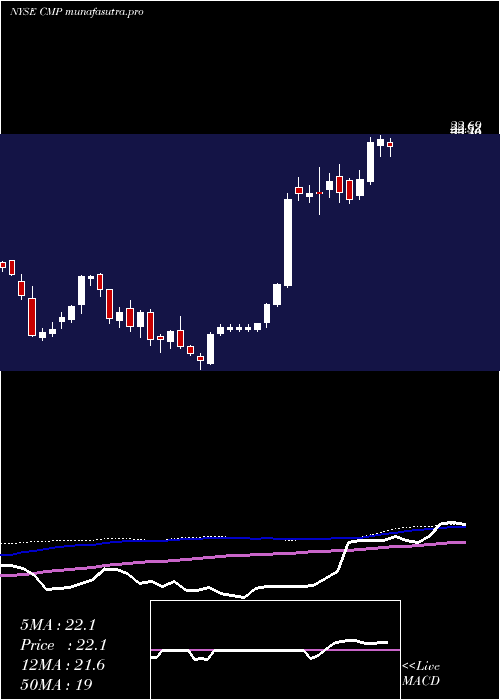
Monthly price and charts CompassMinerals Strong monthly Stock price targets for CompassMinerals CMP are 19.42 and 21.5 | Monthly Target 1 | 17.75 | | Monthly Target 2 | 19.01 | | Monthly Target 3 | 19.826666666667 | | Monthly Target 4 | 21.09 | | Monthly Target 5 | 21.91 |
Monthly price and volumes Compass Minerals
| Date |
Closing |
Open |
Range |
Volume |
Fri 05 December 2025 |
20.28 (6.79%) |
18.94 |
18.56 - 20.64 |
0.1596 times |
Fri 28 November 2025 |
18.99 (9.52%) |
16.81 |
16.40 - 19.00 |
0.5965 times |
Fri 31 October 2025 |
17.34 (-9.69%) |
19.18 |
16.68 - 20.39 |
0.8153 times |
Tue 30 September 2025 |
19.20 (0.79%) |
18.83 |
17.67 - 19.72 |
0.7892 times |
Fri 29 August 2025 |
19.05 (-4.42%) |
20.24 |
17.95 - 21.58 |
0.8916 times |
Thu 31 July 2025 |
19.93 (-0.8%) |
19.89 |
19.25 - 22.69 |
1.1693 times |
Mon 30 June 2025 |
20.09 (4.58%) |
19.44 |
18.61 - 20.96 |
1.285 times |
Fri 30 May 2025 |
19.21 (42.93%) |
13.31 |
12.99 - 20.75 |
1.9613 times |
Wed 30 April 2025 |
13.44 (44.67%) |
9.29 |
8.60 - 13.50 |
1.3366 times |
Mon 31 March 2025 |
9.29 (-11.02%) |
10.58 |
9.03 - 11.83 |
0.9957 times |
Fri 28 February 2025 |
10.44 (-10.46%) |
11.58 |
10.08 - 12.76 |
1.2681 times |
DMA SMA EMA moving averages of Compass Minerals CMP
DMA (daily moving average) of Compass Minerals CMP
| DMA period | DMA value | | 5 day DMA | 19.59 | | 12 day DMA | 18.64 | | 20 day DMA | 18.22 | | 35 day DMA | 17.97 | | 50 day DMA | 18.33 | | 100 day DMA | 18.88 | | 150 day DMA | 19.12 | | 200 day DMA | 17.03 | EMA (exponential moving average) of Compass Minerals CMP
| EMA period | EMA current | EMA prev | EMA prev2 | | 5 day EMA | 19.69 | 19.39 | 19.02 | | 12 day EMA | 18.96 | 18.72 | 18.46 | | 20 day EMA | 18.57 | 18.39 | 18.21 | | 35 day EMA | 18.47 | 18.36 | 18.26 | | 50 day EMA | 18.48 | 18.41 | 18.34 |
SMA (simple moving average) of Compass Minerals CMP
| SMA period | SMA current | SMA prev | SMA prev2 | | 5 day SMA | 19.59 | 19.34 | 19 | | 12 day SMA | 18.64 | 18.37 | 18.12 | | 20 day SMA | 18.22 | 18.04 | 17.88 | | 35 day SMA | 17.97 | 17.91 | 17.89 | | 50 day SMA | 18.33 | 18.31 | 18.28 | | 100 day SMA | 18.88 | 18.89 | 18.91 | | 150 day SMA | 19.12 | 19.07 | 19.02 | | 200 day SMA | 17.03 | 16.99 | 16.95 |
|
|
