CommercialMetals CMC full analysis,charts,indicators,moving averages,SMA,DMA,EMA,ADX,MACD,RSICommercial Metals CMC WideScreen charts, DMA,SMA,EMA technical analysis, forecast prediction, by indicators ADX,MACD,RSI,CCI NYSE stock exchange
operates under Basic Industries sector & deals in Steel Iron Ore
Daily price and charts and targets CommercialMetals Strong Daily Stock price targets for CommercialMetals CMC are 66.45 and 68.77 | Daily Target 1 | 64.76 | | Daily Target 2 | 65.81 | | Daily Target 3 | 67.08 | | Daily Target 4 | 68.13 | | Daily Target 5 | 69.4 |
Daily price and volume Commercial Metals
| Date |
Closing |
Open |
Range |
Volume |
Fri 05 December 2025 |
66.86 (2.5%) |
66.77 |
66.03 - 68.35 |
1.9012 times |
Thu 04 December 2025 |
65.23 (-0.96%) |
65.33 |
64.33 - 65.83 |
0.6915 times |
Wed 03 December 2025 |
65.86 (3.62%) |
63.57 |
63.57 - 65.94 |
0.9293 times |
Tue 02 December 2025 |
63.56 (-0.81%) |
64.56 |
63.43 - 64.56 |
0.6927 times |
Mon 01 December 2025 |
64.08 (0.47%) |
63.00 |
63.00 - 64.50 |
0.8088 times |
Fri 28 November 2025 |
63.78 (-0.16%) |
63.91 |
63.21 - 64.00 |
0.4842 times |
Wed 26 November 2025 |
63.88 (2%) |
62.62 |
62.62 - 63.97 |
1.0957 times |
Tue 25 November 2025 |
62.63 (4%) |
60.45 |
60.28 - 62.77 |
0.616 times |
Mon 24 November 2025 |
60.22 (1.52%) |
58.72 |
58.61 - 60.44 |
1.5891 times |
Fri 21 November 2025 |
59.32 (3.44%) |
57.72 |
57.01 - 60.31 |
1.1915 times |
Thu 20 November 2025 |
57.35 (-0.52%) |
58.50 |
57.19 - 59.30 |
1.0783 times |
Weekly price and charts CommercialMetals Strong weekly Stock price targets for CommercialMetals CMC are 64.93 and 70.28 | Weekly Target 1 | 60.72 | | Weekly Target 2 | 63.79 | | Weekly Target 3 | 66.07 | | Weekly Target 4 | 69.14 | | Weekly Target 5 | 71.42 |
Weekly price and volumes for Commercial Metals
| Date |
Closing |
Open |
Range |
Volume |
Fri 05 December 2025 |
66.86 (4.83%) |
63.00 |
63.00 - 68.35 |
0.8822 times |
Fri 28 November 2025 |
63.78 (7.52%) |
58.72 |
58.61 - 64.00 |
0.6647 times |
Fri 21 November 2025 |
59.32 (0.58%) |
58.50 |
57.01 - 60.31 |
0.9547 times |
Fri 14 November 2025 |
58.98 (0.36%) |
59.48 |
58.22 - 61.67 |
0.9003 times |
Fri 07 November 2025 |
58.77 (-0.99%) |
57.02 |
55.97 - 58.90 |
0.7288 times |
Fri 31 October 2025 |
59.36 (0%) |
59.51 |
59.05 - 60.13 |
0.1877 times |
Fri 31 October 2025 |
59.36 (-2.82%) |
61.32 |
59.02 - 62.00 |
1.4828 times |
Fri 24 October 2025 |
61.08 (6.45%) |
58.31 |
57.84 - 62.38 |
1.513 times |
Fri 17 October 2025 |
57.38 (-1.09%) |
58.24 |
53.08 - 61.00 |
2.3148 times |
Tue 07 October 2025 |
58.01 (-1.68%) |
59.00 |
57.92 - 59.46 |
0.371 times |
Fri 03 October 2025 |
59.00 (0.55%) |
58.95 |
55.54 - 59.52 |
0.7961 times |
Monthly price and charts CommercialMetals Strong monthly Stock price targets for CommercialMetals CMC are 64.93 and 70.28 | Monthly Target 1 | 60.72 | | Monthly Target 2 | 63.79 | | Monthly Target 3 | 66.07 | | Monthly Target 4 | 69.14 | | Monthly Target 5 | 71.42 |
Monthly price and volumes Commercial Metals
| Date |
Closing |
Open |
Range |
Volume |
Fri 05 December 2025 |
66.86 (4.83%) |
63.00 |
63.00 - 68.35 |
0.2107 times |
Fri 28 November 2025 |
63.78 (7.45%) |
57.02 |
55.97 - 64.00 |
0.7759 times |
Fri 31 October 2025 |
59.36 (3.63%) |
57.37 |
53.08 - 62.38 |
1.4855 times |
Tue 30 September 2025 |
57.28 (-0.68%) |
56.28 |
55.54 - 60.30 |
1.025 times |
Fri 29 August 2025 |
57.67 (11.2%) |
50.40 |
49.66 - 59.40 |
0.9681 times |
Thu 31 July 2025 |
51.86 (6.03%) |
48.64 |
48.14 - 54.54 |
0.9255 times |
Mon 30 June 2025 |
48.91 (4.98%) |
50.16 |
47.07 - 51.51 |
1.1999 times |
Fri 30 May 2025 |
46.59 (4.6%) |
44.84 |
44.64 - 49.42 |
0.7829 times |
Wed 30 April 2025 |
44.54 (-3.19%) |
45.78 |
37.92 - 47.15 |
1.241 times |
Mon 31 March 2025 |
46.01 (-5.02%) |
49.79 |
42.62 - 50.35 |
1.3854 times |
Fri 28 February 2025 |
48.44 (-0.1%) |
48.01 |
47.37 - 53.42 |
0.9722 times |
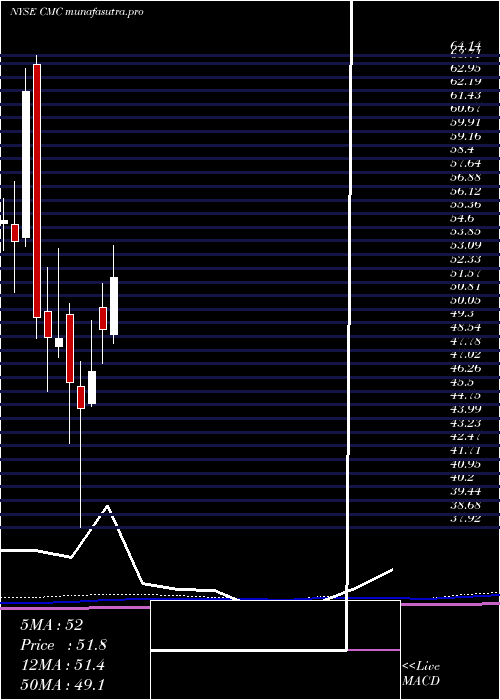
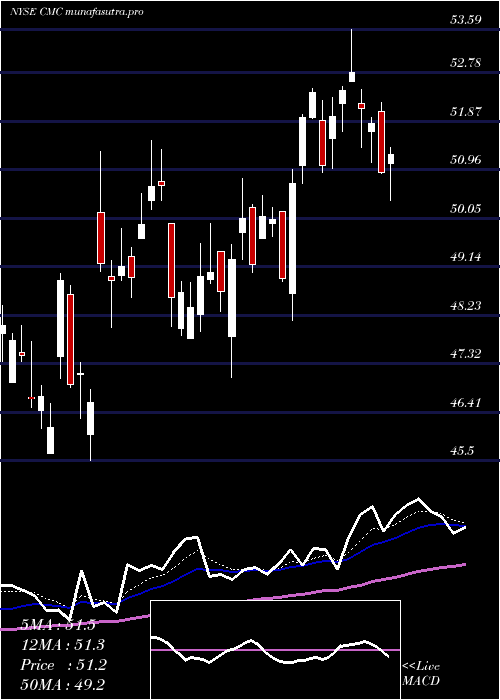
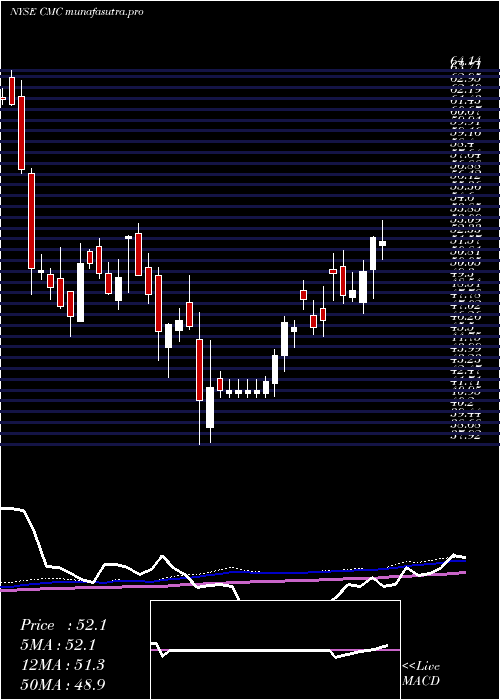
DMA SMA EMA moving averages of Commercial Metals CMC
DMA (daily moving average) of Commercial Metals CMC
| DMA period | DMA value | | 5 day DMA | 65.12 | | 12 day DMA | 62.54 | | 20 day DMA | 61.23 | | 35 day DMA | 60.46 | | 50 day DMA | 59.78 | | 100 day DMA | 57.72 | | 150 day DMA | 54.66 | | 200 day DMA | 52.27 | EMA (exponential moving average) of Commercial Metals CMC
| EMA period | EMA current | EMA prev | EMA prev2 | | 5 day EMA | 65.23 | 64.42 | 64.01 | | 12 day EMA | 63.36 | 62.72 | 62.26 | | 20 day EMA | 62.15 | 61.65 | 61.27 | | 35 day EMA | 61 | 60.66 | 60.39 | | 50 day EMA | 60.21 | 59.94 | 59.72 |
SMA (simple moving average) of Commercial Metals CMC
| SMA period | SMA current | SMA prev | SMA prev2 | | 5 day SMA | 65.12 | 64.5 | 64.23 | | 12 day SMA | 62.54 | 61.79 | 61.25 | | 20 day SMA | 61.23 | 60.76 | 60.37 | | 35 day SMA | 60.46 | 60.13 | 59.98 | | 50 day SMA | 59.78 | 59.59 | 59.45 | | 100 day SMA | 57.72 | 57.58 | 57.45 | | 150 day SMA | 54.66 | 54.51 | 54.37 | | 200 day SMA | 52.27 | 52.2 | 52.14 |
|
|
