ColgatePalmolive CL full analysis,charts,indicators,moving averages,SMA,DMA,EMA,ADX,MACD,RSIColgate Palmolive CL WideScreen charts, DMA,SMA,EMA technical analysis, forecast prediction, by indicators ADX,MACD,RSI,CCI NYSE stock exchange
operates under Consumer Non Durables sector & deals in Package Goods Cosmetics
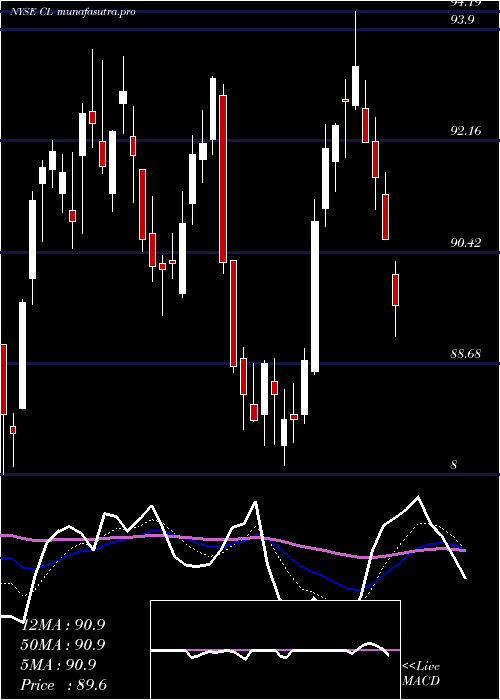
Daily price and charts and targets ColgatePalmolive Strong Daily Stock price targets for ColgatePalmolive CL are 77.1 and 78.05 | Daily Target 1 | 76.93 | | Daily Target 2 | 77.27 | | Daily Target 3 | 77.883333333333 | | Daily Target 4 | 78.22 | | Daily Target 5 | 78.83 |
Daily price and volume Colgate Palmolive
| Date |
Closing |
Open |
Range |
Volume |
Thu 04 December 2025 |
77.60 (-0.77%) |
78.21 |
77.55 - 78.50 |
0.9507 times |
Wed 03 December 2025 |
78.20 (-0.79%) |
79.00 |
78.12 - 79.67 |
0.9139 times |
Tue 02 December 2025 |
78.82 (-1.4%) |
79.46 |
77.86 - 79.46 |
1.53 times |
Mon 01 December 2025 |
79.94 (-0.56%) |
80.30 |
79.61 - 80.69 |
1.0857 times |
Fri 28 November 2025 |
80.39 (0.44%) |
80.00 |
79.91 - 80.44 |
0.4238 times |
Wed 26 November 2025 |
80.04 (0.28%) |
79.48 |
79.31 - 80.30 |
0.6683 times |
Tue 25 November 2025 |
79.82 (0.81%) |
79.78 |
79.21 - 80.07 |
1.0064 times |
Mon 24 November 2025 |
79.18 (-2.16%) |
80.91 |
79.11 - 81.10 |
1.1737 times |
Fri 21 November 2025 |
80.93 (2.62%) |
79.39 |
79.10 - 81.35 |
1.2598 times |
Thu 20 November 2025 |
78.86 (0.5%) |
78.08 |
77.63 - 79.21 |
0.9878 times |
Wed 19 November 2025 |
78.47 (-1.08%) |
79.25 |
78.33 - 79.36 |
0.6325 times |
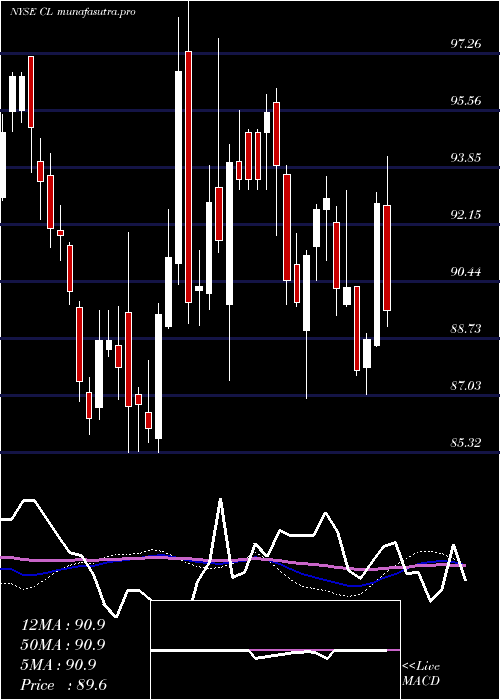
Weekly price and charts ColgatePalmolive Strong weekly Stock price targets for ColgatePalmolive CL are 76.01 and 79.15 | Weekly Target 1 | 75.47 | | Weekly Target 2 | 76.54 | | Weekly Target 3 | 78.613333333333 | | Weekly Target 4 | 79.68 | | Weekly Target 5 | 81.75 |
Weekly price and volumes for Colgate Palmolive
| Date |
Closing |
Open |
Range |
Volume |
Thu 04 December 2025 |
77.60 (-3.47%) |
80.30 |
77.55 - 80.69 |
0.953 times |
Fri 28 November 2025 |
80.39 (-0.67%) |
80.91 |
79.11 - 81.10 |
0.6961 times |
Fri 21 November 2025 |
80.93 (3.69%) |
78.28 |
77.63 - 81.35 |
1.0447 times |
Fri 14 November 2025 |
78.05 (-0.9%) |
78.39 |
77.87 - 79.74 |
1.1054 times |
Fri 07 November 2025 |
78.76 (2.22%) |
75.07 |
75.00 - 78.99 |
0.9697 times |
Fri 31 October 2025 |
77.05 (0%) |
75.55 |
74.62 - 77.16 |
0.6213 times |
Fri 31 October 2025 |
77.05 (-1.22%) |
77.87 |
74.62 - 78.06 |
1.7611 times |
Fri 24 October 2025 |
78.00 (-1.64%) |
79.23 |
77.88 - 80.43 |
0.7873 times |
Fri 17 October 2025 |
79.30 (1.72%) |
77.45 |
76.68 - 79.40 |
0.9881 times |
Fri 10 October 2025 |
77.96 (-0.18%) |
78.07 |
77.09 - 79.47 |
1.0732 times |
Fri 03 October 2025 |
78.10 (-1.87%) |
79.61 |
77.91 - 80.57 |
0.984 times |
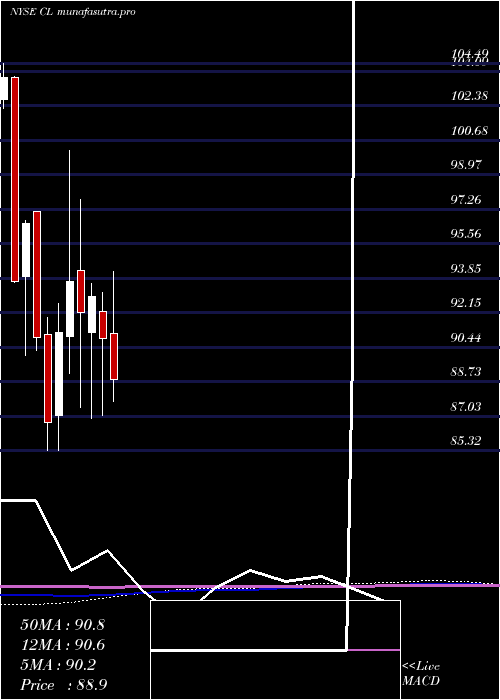
Monthly price and charts ColgatePalmolive Strong monthly Stock price targets for ColgatePalmolive CL are 76.01 and 79.15 | Monthly Target 1 | 75.47 | | Monthly Target 2 | 76.54 | | Monthly Target 3 | 78.613333333333 | | Monthly Target 4 | 79.68 | | Monthly Target 5 | 81.75 |
Monthly price and volumes Colgate Palmolive
| Date |
Closing |
Open |
Range |
Volume |
Thu 04 December 2025 |
77.60 (-3.47%) |
80.30 |
77.55 - 80.69 |
0.2554 times |
Fri 28 November 2025 |
80.39 (4.33%) |
75.07 |
75.00 - 81.35 |
1.0226 times |
Fri 31 October 2025 |
77.05 (-3.62%) |
80.25 |
74.62 - 80.43 |
1.5587 times |
Tue 30 September 2025 |
79.94 (-4.91%) |
84.18 |
78.76 - 85.76 |
1.0924 times |
Fri 29 August 2025 |
84.07 (0.26%) |
84.02 |
82.58 - 87.95 |
0.9515 times |
Thu 31 July 2025 |
83.85 (-7.76%) |
91.10 |
83.53 - 94.19 |
0.9698 times |
Mon 30 June 2025 |
90.90 (-2.19%) |
92.22 |
87.07 - 93.17 |
0.9514 times |
Fri 30 May 2025 |
92.94 (0.81%) |
91.16 |
86.94 - 93.60 |
0.9285 times |
Wed 30 April 2025 |
92.19 (-1.61%) |
94.24 |
87.48 - 97.73 |
1.1972 times |
Mon 31 March 2025 |
93.70 (2.78%) |
90.99 |
89.14 - 100.18 |
1.0725 times |
Fri 28 February 2025 |
91.17 (5.16%) |
87.07 |
85.32 - 92.59 |
0.779 times |
DMA SMA EMA moving averages of Colgate Palmolive CL
DMA (daily moving average) of Colgate Palmolive CL
| DMA period | DMA value | | 5 day DMA | 78.99 | | 12 day DMA | 79.3 | | 20 day DMA | 78.99 | | 35 day DMA | 78.45 | | 50 day DMA | 78.48 | | 100 day DMA | 81.53 | | 150 day DMA | 84.54 | | 200 day DMA | 86.44 | EMA (exponential moving average) of Colgate Palmolive CL
| EMA period | EMA current | EMA prev | EMA prev2 | | 5 day EMA | 78.61 | 79.11 | 79.56 | | 12 day EMA | 78.95 | 79.19 | 79.37 | | 20 day EMA | 78.88 | 79.01 | 79.09 | | 35 day EMA | 78.88 | 78.96 | 79 | | 50 day EMA | 78.7 | 78.75 | 78.77 |
SMA (simple moving average) of Colgate Palmolive CL
| SMA period | SMA current | SMA prev | SMA prev2 | | 5 day SMA | 78.99 | 79.48 | 79.8 | | 12 day SMA | 79.3 | 79.4 | 79.39 | | 20 day SMA | 78.99 | 78.95 | 78.87 | | 35 day SMA | 78.45 | 78.45 | 78.45 | | 50 day SMA | 78.48 | 78.55 | 78.59 | | 100 day SMA | 81.53 | 81.64 | 81.74 | | 150 day SMA | 84.54 | 84.64 | 84.73 | | 200 day SMA | 86.44 | 86.49 | 86.53 |
|
|
