CityficeReit CIO full analysis,charts,indicators,moving averages,SMA,DMA,EMA,ADX,MACD,RSICityfice Reit CIO WideScreen charts, DMA,SMA,EMA technical analysis, forecast prediction, by indicators ADX,MACD,RSI,CCI NYSE stock exchange
operates under Consumer Services sector & deals in Real Estate Investment Trusts
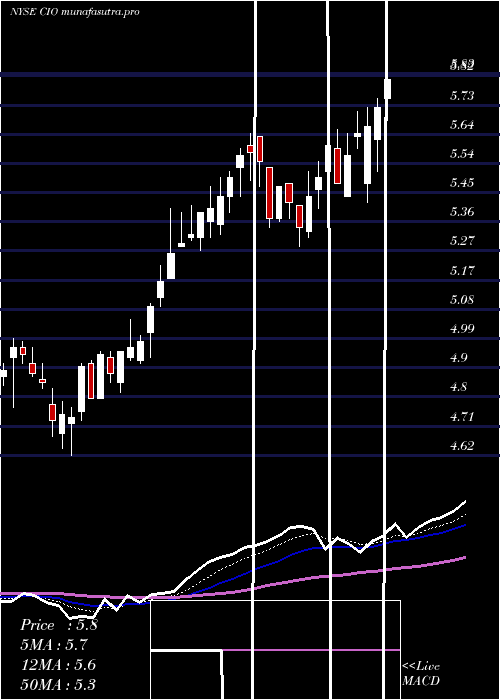
Daily price and charts and targets CityficeReit Strong Daily Stock price targets for CityficeReit CIO are 6.96 and 6.99 | Daily Target 1 | 6.95 | | Daily Target 2 | 6.97 | | Daily Target 3 | 6.9833333333333 | | Daily Target 4 | 7 | | Daily Target 5 | 7.01 |
Daily price and volume Cityfice Reit
| Date |
Closing |
Open |
Range |
Volume |
Mon 20 October 2025 |
6.98 (0.29%) |
7.00 |
6.97 - 7.00 |
0.3562 times |
Fri 17 October 2025 |
6.96 (0%) |
6.96 |
6.96 - 6.97 |
0.8491 times |
Thu 16 October 2025 |
6.96 (-0.14%) |
6.96 |
6.96 - 6.97 |
0.6684 times |
Wed 15 October 2025 |
6.97 (0%) |
6.97 |
6.96 - 6.98 |
1.5086 times |
Tue 14 October 2025 |
6.97 (0%) |
6.96 |
6.96 - 6.98 |
1.0592 times |
Mon 13 October 2025 |
6.97 (0.14%) |
6.97 |
6.96 - 6.97 |
0.5356 times |
Tue 07 October 2025 |
6.96 (0%) |
6.98 |
6.96 - 6.98 |
0.5017 times |
Mon 06 October 2025 |
6.96 (-0.43%) |
6.98 |
6.96 - 7.00 |
0.4905 times |
Fri 03 October 2025 |
6.99 (0.72%) |
6.95 |
6.94 - 7.01 |
1.4466 times |
Thu 02 October 2025 |
6.94 (-0.14%) |
6.95 |
6.93 - 6.96 |
2.5842 times |
Wed 01 October 2025 |
6.95 (-0.14%) |
6.95 |
6.95 - 6.96 |
0.6304 times |
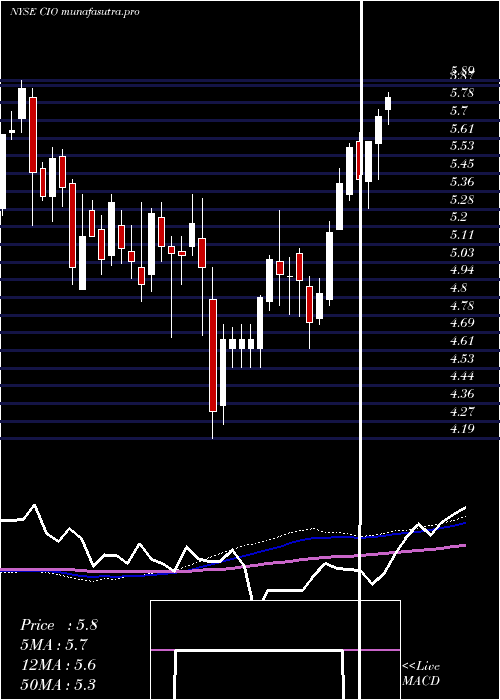
Weekly price and charts CityficeReit Strong weekly Stock price targets for CityficeReit CIO are 6.96 and 6.99 | Weekly Target 1 | 6.95 | | Weekly Target 2 | 6.97 | | Weekly Target 3 | 6.9833333333333 | | Weekly Target 4 | 7 | | Weekly Target 5 | 7.01 |
Weekly price and volumes for Cityfice Reit
| Date |
Closing |
Open |
Range |
Volume |
Mon 20 October 2025 |
6.98 (0.29%) |
7.00 |
6.97 - 7.00 |
0.1011 times |
Fri 17 October 2025 |
6.96 (0%) |
6.97 |
6.96 - 6.98 |
1.3114 times |
Tue 07 October 2025 |
6.96 (-0.43%) |
6.98 |
6.96 - 7.00 |
0.2816 times |
Fri 03 October 2025 |
6.99 (0.58%) |
6.95 |
6.93 - 7.01 |
1.7568 times |
Fri 26 September 2025 |
6.95 (0%) |
6.96 |
6.93 - 6.96 |
1.164 times |
Fri 19 September 2025 |
6.95 (0.14%) |
6.94 |
6.94 - 6.97 |
1.968 times |
Fri 12 September 2025 |
6.94 (0%) |
6.93 |
6.93 - 6.95 |
1.7142 times |
Fri 05 September 2025 |
6.94 (0.14%) |
6.93 |
6.92 - 6.95 |
0.9428 times |
Fri 29 August 2025 |
6.93 (0%) |
6.94 |
6.93 - 6.94 |
0.1059 times |
Fri 29 August 2025 |
6.93 (-0.14%) |
6.94 |
6.93 - 6.95 |
0.6543 times |
Fri 22 August 2025 |
6.94 (0%) |
6.93 |
6.91 - 6.94 |
0.8959 times |
Monthly price and charts CityficeReit Strong monthly Stock price targets for CityficeReit CIO are 6.96 and 7.04 | Monthly Target 1 | 6.89 | | Monthly Target 2 | 6.94 | | Monthly Target 3 | 6.9733333333333 | | Monthly Target 4 | 7.02 | | Monthly Target 5 | 7.05 |
Monthly price and volumes Cityfice Reit
| Date |
Closing |
Open |
Range |
Volume |
Mon 20 October 2025 |
6.98 (0.29%) |
6.95 |
6.93 - 7.01 |
0.8072 times |
Tue 30 September 2025 |
6.96 (0.43%) |
6.93 |
6.92 - 6.97 |
1.665 times |
Fri 29 August 2025 |
6.93 (-0.14%) |
6.93 |
6.91 - 6.99 |
1.034 times |
Thu 31 July 2025 |
6.94 (29.96%) |
5.33 |
5.31 - 6.96 |
3.2454 times |
Mon 30 June 2025 |
5.34 (9.43%) |
4.85 |
4.82 - 5.64 |
0.4356 times |
Fri 30 May 2025 |
4.88 (-3.94%) |
5.09 |
4.62 - 5.27 |
0.4741 times |
Wed 30 April 2025 |
5.08 (-2.12%) |
5.13 |
4.19 - 5.22 |
0.7466 times |
Mon 31 March 2025 |
5.19 (-1.33%) |
5.24 |
4.67 - 5.35 |
0.5803 times |
Fri 28 February 2025 |
5.26 (-0.94%) |
5.20 |
4.84 - 5.31 |
0.3982 times |
Fri 31 January 2025 |
5.31 (-3.8%) |
5.50 |
4.90 - 5.57 |
0.6136 times |
Tue 31 December 2024 |
5.52 (-1.95%) |
5.64 |
5.20 - 5.89 |
0.6069 times |
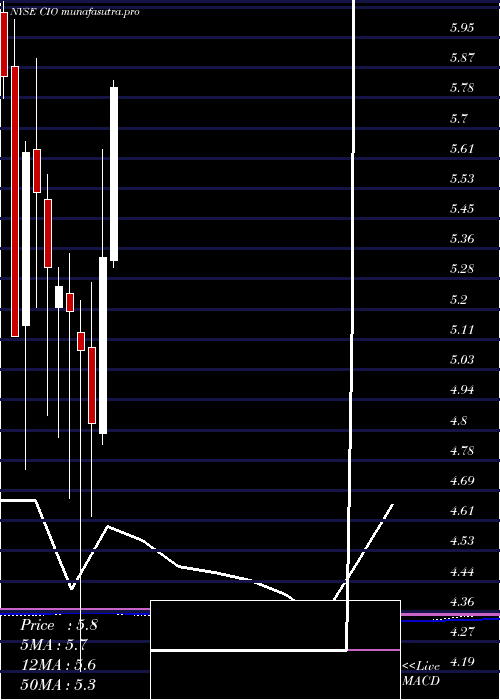
DMA SMA EMA moving averages of Cityfice Reit CIO
DMA (daily moving average) of Cityfice Reit CIO
| DMA period | DMA value | | 5 day DMA | 6.97 | | 12 day DMA | 6.96 | | 20 day DMA | 6.96 | | 35 day DMA | 6.95 | | 50 day DMA | 6.95 | | 100 day DMA | 6.29 | | 150 day DMA | 5.83 | | 200 day DMA | 5.66 | EMA (exponential moving average) of Cityfice Reit CIO
| EMA period | EMA current | EMA prev | EMA prev2 | | 5 day EMA | 6.97 | 6.96 | 6.96 | | 12 day EMA | 6.95 | 6.95 | 6.95 | | 20 day EMA | 6.94 | 6.94 | 6.94 | | 35 day EMA | 6.94 | 6.94 | 6.94 | | 50 day EMA | 6.94 | 6.94 | 6.94 |
SMA (simple moving average) of Cityfice Reit CIO
| SMA period | SMA current | SMA prev | SMA prev2 | | 5 day SMA | 6.97 | 6.97 | 6.97 | | 12 day SMA | 6.96 | 6.96 | 6.96 | | 20 day SMA | 6.96 | 6.96 | 6.96 | | 35 day SMA | 6.95 | 6.95 | 6.95 | | 50 day SMA | 6.95 | 6.94 | 6.94 | | 100 day SMA | 6.29 | 6.27 | 6.25 | | 150 day SMA | 5.83 | 5.81 | 5.8 | | 200 day SMA | 5.66 | 5.65 | 5.64 |
|
|
