ChimeraInvt CIM-C full analysis,charts,indicators,moving averages,SMA,DMA,EMA,ADX,MACD,RSIChimera Invt CIM-C WideScreen charts, DMA,SMA,EMA technical analysis, forecast prediction, by indicators ADX,MACD,RSI,CCI NYSE stock exchange
Daily price and charts and targets ChimeraInvt Strong Daily Stock price targets for ChimeraInvt CIM-C are 22.55 and 22.64 | Daily Target 1 | 22.47 | | Daily Target 2 | 22.53 | | Daily Target 3 | 22.56 | | Daily Target 4 | 22.62 | | Daily Target 5 | 22.65 |
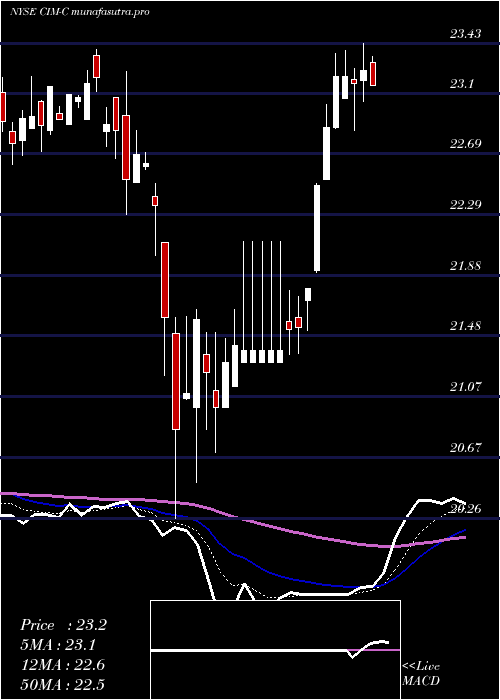
Daily price and volume Chimera Invt
| Date |
Closing |
Open |
Range |
Volume |
Mon 20 October 2025 |
22.59 (0.53%) |
22.50 |
22.50 - 22.59 |
1.0479 times |
Fri 17 October 2025 |
22.47 (-0.22%) |
22.51 |
22.35 - 22.60 |
1.3284 times |
Thu 16 October 2025 |
22.52 (-0.27%) |
22.67 |
22.52 - 22.67 |
0.6848 times |
Wed 15 October 2025 |
22.58 (-0.35%) |
22.71 |
22.58 - 22.75 |
0.5033 times |
Tue 14 October 2025 |
22.66 (-0.18%) |
22.70 |
22.65 - 22.76 |
1.1634 times |
Mon 13 October 2025 |
22.70 (-0.79%) |
22.79 |
22.62 - 22.80 |
1.4026 times |
Fri 10 October 2025 |
22.88 (-0.22%) |
23.00 |
22.76 - 23.05 |
1.0974 times |
Thu 09 October 2025 |
22.93 (-0.39%) |
23.02 |
22.90 - 23.12 |
1.6667 times |
Wed 08 October 2025 |
23.02 (-0.22%) |
23.04 |
22.95 - 23.04 |
0.4455 times |
Tue 07 October 2025 |
23.07 (0.13%) |
23.09 |
22.99 - 23.15 |
0.6601 times |
Mon 06 October 2025 |
23.04 (0.17%) |
22.91 |
22.91 - 23.10 |
0.3135 times |
Weekly price and charts ChimeraInvt Strong weekly Stock price targets for ChimeraInvt CIM-C are 22.55 and 22.64 | Weekly Target 1 | 22.47 | | Weekly Target 2 | 22.53 | | Weekly Target 3 | 22.56 | | Weekly Target 4 | 22.62 | | Weekly Target 5 | 22.65 |
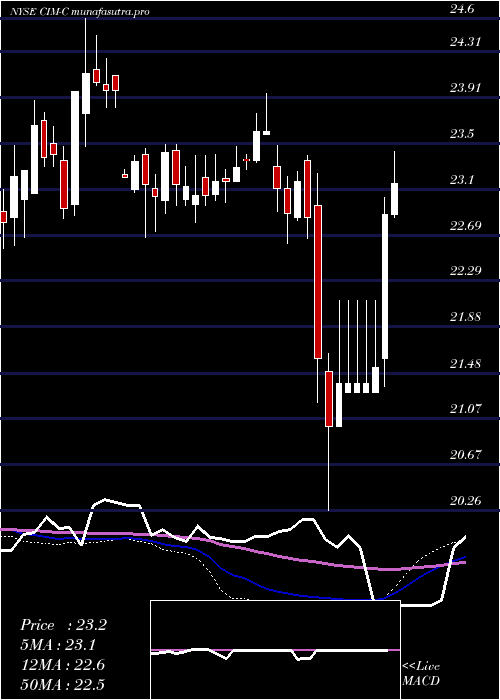
Weekly price and volumes for Chimera Invt
| Date |
Closing |
Open |
Range |
Volume |
Mon 20 October 2025 |
22.59 (0.53%) |
22.50 |
22.50 - 22.59 |
0.1516 times |
Fri 17 October 2025 |
22.47 (-1.79%) |
22.79 |
22.35 - 22.80 |
0.7355 times |
Fri 10 October 2025 |
22.88 (-0.52%) |
22.91 |
22.76 - 23.15 |
0.6054 times |
Fri 03 October 2025 |
23.00 (0.48%) |
22.96 |
22.96 - 23.41 |
3.1487 times |
Fri 26 September 2025 |
22.89 (-1.25%) |
23.10 |
22.83 - 23.14 |
0.7081 times |
Fri 19 September 2025 |
23.18 (0.35%) |
23.19 |
23.00 - 23.25 |
0.6388 times |
Fri 12 September 2025 |
23.10 (-0.39%) |
23.19 |
22.92 - 23.28 |
1.4364 times |
Fri 05 September 2025 |
23.19 (-0.26%) |
22.82 |
22.68 - 23.20 |
0.6699 times |
Fri 29 August 2025 |
23.25 (0%) |
23.27 |
23.11 - 23.31 |
0.6949 times |
Fri 29 August 2025 |
23.25 (-0.17%) |
23.28 |
23.11 - 23.45 |
1.2107 times |
Fri 22 August 2025 |
23.29 (1.48%) |
22.91 |
22.82 - 23.29 |
0.7343 times |
Monthly price and charts ChimeraInvt Strong monthly Stock price targets for ChimeraInvt CIM-C are 21.97 and 22.98 | Monthly Target 1 | 21.76 | | Monthly Target 2 | 22.17 | | Monthly Target 3 | 22.766666666667 | | Monthly Target 4 | 23.18 | | Monthly Target 5 | 23.78 |
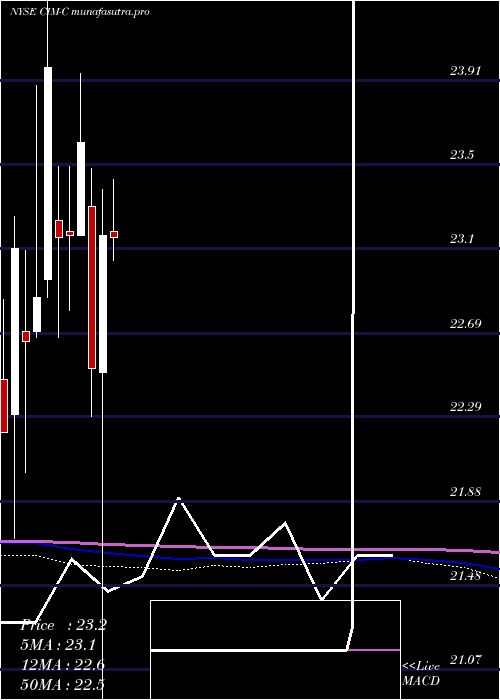
Monthly price and volumes Chimera Invt
| Date |
Closing |
Open |
Range |
Volume |
Mon 20 October 2025 |
22.59 (-2.21%) |
23.12 |
22.35 - 23.36 |
0.3568 times |
Tue 30 September 2025 |
23.10 (-0.65%) |
22.82 |
22.68 - 23.41 |
1.2953 times |
Fri 29 August 2025 |
23.25 (1.53%) |
22.89 |
22.40 - 23.45 |
0.9034 times |
Thu 31 July 2025 |
22.90 (1.46%) |
22.75 |
22.50 - 23.44 |
1.0453 times |
Mon 30 June 2025 |
22.57 (-0.83%) |
22.53 |
22.26 - 22.98 |
0.9176 times |
Fri 30 May 2025 |
22.76 (-1.73%) |
23.18 |
22.28 - 23.43 |
0.8883 times |
Wed 30 April 2025 |
23.16 (2.84%) |
22.50 |
20.26 - 23.38 |
1.1807 times |
Mon 31 March 2025 |
22.52 (-4.62%) |
23.30 |
22.29 - 23.48 |
1.1307 times |
Fri 28 February 2025 |
23.61 (1.94%) |
23.16 |
23.16 - 23.94 |
0.8644 times |
Fri 31 January 2025 |
23.16 (0.04%) |
23.18 |
22.80 - 23.49 |
1.4175 times |
Tue 31 December 2024 |
23.15 (-3.42%) |
23.23 |
22.67 - 23.49 |
1.1117 times |
DMA SMA EMA moving averages of Chimera Invt CIM-C
DMA (daily moving average) of Chimera Invt CIM-C
| DMA period | DMA value | | 5 day DMA | 22.56 | | 12 day DMA | 22.79 | | 20 day DMA | 22.89 | | 35 day DMA | 22.99 | | 50 day DMA | 23.03 | | 100 day DMA | 22.9 | | 150 day DMA | 22.73 | | 200 day DMA | 22.87 | EMA (exponential moving average) of Chimera Invt CIM-C
| EMA period | EMA current | EMA prev | EMA prev2 | | 5 day EMA | 22.6 | 22.6 | 22.66 | | 12 day EMA | 22.73 | 22.76 | 22.81 | | 20 day EMA | 22.83 | 22.85 | 22.89 | | 35 day EMA | 22.91 | 22.93 | 22.96 | | 50 day EMA | 22.96 | 22.97 | 22.99 |
SMA (simple moving average) of Chimera Invt CIM-C
| SMA period | SMA current | SMA prev | SMA prev2 | | 5 day SMA | 22.56 | 22.59 | 22.67 | | 12 day SMA | 22.79 | 22.83 | 22.88 | | 20 day SMA | 22.89 | 22.92 | 22.96 | | 35 day SMA | 22.99 | 23.01 | 23.03 | | 50 day SMA | 23.03 | 23.03 | 23.03 | | 100 day SMA | 22.9 | 22.91 | 22.91 | | 150 day SMA | 22.73 | 22.73 | 22.74 | | 200 day SMA | 22.87 | 22.87 | 22.87 |
|
|
