ChimeraInvestment CIM full analysis,charts,indicators,moving averages,SMA,DMA,EMA,ADX,MACD,RSIChimera Investment CIM WideScreen charts, DMA,SMA,EMA technical analysis, forecast prediction, by indicators ADX,MACD,RSI,CCI NYSE stock exchange
operates under Consumer Services sector & deals in Real Estate Investment Trusts
Daily price and charts and targets ChimeraInvestment Strong Daily Stock price targets for ChimeraInvestment CIM are 12.93 and 13.05 | Daily Target 1 | 12.84 | | Daily Target 2 | 12.89 | | Daily Target 3 | 12.956666666667 | | Daily Target 4 | 13.01 | | Daily Target 5 | 13.08 |
Daily price and volume Chimera Investment
| Date |
Closing |
Open |
Range |
Volume |
Fri 05 December 2025 |
12.95 (0.78%) |
12.90 |
12.90 - 13.02 |
0.9305 times |
Thu 04 December 2025 |
12.85 (-0.85%) |
12.95 |
12.79 - 12.95 |
0.8933 times |
Wed 03 December 2025 |
12.96 (1.49%) |
12.78 |
12.75 - 12.97 |
0.981 times |
Tue 02 December 2025 |
12.77 (-0.62%) |
12.92 |
12.76 - 12.93 |
0.8069 times |
Mon 01 December 2025 |
12.85 (0.47%) |
12.64 |
12.60 - 12.89 |
1.252 times |
Fri 28 November 2025 |
12.79 (-0.16%) |
12.81 |
12.73 - 12.86 |
0.5625 times |
Wed 26 November 2025 |
12.81 (1.51%) |
12.55 |
12.55 - 12.89 |
1.2223 times |
Tue 25 November 2025 |
12.62 (3.61%) |
12.25 |
12.20 - 12.64 |
0.9791 times |
Mon 24 November 2025 |
12.18 (-0.16%) |
12.16 |
12.03 - 12.21 |
1.1048 times |
Fri 21 November 2025 |
12.20 (2.52%) |
12.00 |
11.92 - 12.24 |
1.2676 times |
Thu 20 November 2025 |
11.90 (0.08%) |
11.95 |
11.90 - 12.10 |
0.8159 times |
Weekly price and charts ChimeraInvestment Strong weekly Stock price targets for ChimeraInvestment CIM are 12.78 and 13.2 | Weekly Target 1 | 12.44 | | Weekly Target 2 | 12.69 | | Weekly Target 3 | 12.856666666667 | | Weekly Target 4 | 13.11 | | Weekly Target 5 | 13.28 |
Weekly price and volumes for Chimera Investment
| Date |
Closing |
Open |
Range |
Volume |
Fri 05 December 2025 |
12.95 (1.25%) |
12.64 |
12.60 - 13.02 |
1.0715 times |
Fri 28 November 2025 |
12.79 (4.84%) |
12.16 |
12.03 - 12.89 |
0.8524 times |
Fri 21 November 2025 |
12.20 (1.41%) |
12.01 |
11.67 - 12.24 |
1.0397 times |
Fri 14 November 2025 |
12.03 (-1.39%) |
12.25 |
11.81 - 12.29 |
1.1253 times |
Fri 07 November 2025 |
12.20 (-4.39%) |
12.68 |
11.71 - 13.02 |
1.6652 times |
Fri 31 October 2025 |
12.76 (0%) |
12.60 |
12.45 - 12.82 |
0.301 times |
Fri 31 October 2025 |
12.76 (-2.3%) |
13.07 |
12.45 - 13.15 |
1.1945 times |
Fri 24 October 2025 |
13.06 (2.59%) |
12.71 |
12.65 - 13.17 |
0.824 times |
Fri 17 October 2025 |
12.73 (-0.47%) |
12.89 |
12.60 - 13.16 |
0.878 times |
Fri 10 October 2025 |
12.79 (-4.48%) |
13.40 |
12.67 - 13.40 |
1.0483 times |
Fri 03 October 2025 |
13.39 (-2.12%) |
13.70 |
12.94 - 13.72 |
1.1192 times |

Monthly price and charts ChimeraInvestment Strong monthly Stock price targets for ChimeraInvestment CIM are 12.78 and 13.2 | Monthly Target 1 | 12.44 | | Monthly Target 2 | 12.69 | | Monthly Target 3 | 12.856666666667 | | Monthly Target 4 | 13.11 | | Monthly Target 5 | 13.28 |
Monthly price and volumes Chimera Investment
| Date |
Closing |
Open |
Range |
Volume |
Fri 05 December 2025 |
12.95 (1.25%) |
12.64 |
12.60 - 13.02 |
0.2942 times |
Fri 28 November 2025 |
12.79 (0.24%) |
12.68 |
11.67 - 13.02 |
1.2856 times |
Fri 31 October 2025 |
12.76 (-3.48%) |
13.22 |
12.45 - 13.57 |
1.3204 times |
Tue 30 September 2025 |
13.22 (-6.7%) |
14.06 |
12.94 - 14.88 |
1.1961 times |
Fri 29 August 2025 |
14.17 (5.98%) |
13.36 |
12.78 - 14.19 |
0.8629 times |
Thu 31 July 2025 |
13.37 (-3.6%) |
13.83 |
13.34 - 14.43 |
0.9022 times |
Mon 30 June 2025 |
13.87 (5.24%) |
13.11 |
12.96 - 14.34 |
0.8994 times |
Fri 30 May 2025 |
13.18 (6.81%) |
12.42 |
11.96 - 14.14 |
0.9741 times |
Wed 30 April 2025 |
12.34 (-3.82%) |
12.83 |
9.85 - 12.89 |
1.2576 times |
Mon 31 March 2025 |
12.83 (-9.84%) |
14.18 |
12.54 - 14.37 |
1.0075 times |
Fri 28 February 2025 |
14.23 (-4.43%) |
14.59 |
13.51 - 15.37 |
1.0735 times |

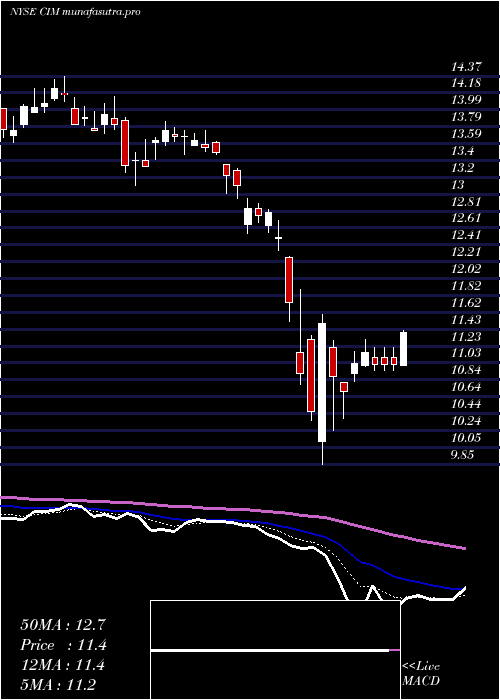
DMA SMA EMA moving averages of Chimera Investment CIM
DMA (daily moving average) of Chimera Investment CIM
| DMA period | DMA value | | 5 day DMA | 12.88 | | 12 day DMA | 12.56 | | 20 day DMA | 12.35 | | 35 day DMA | 12.55 | | 50 day DMA | 12.72 | | 100 day DMA | 13.32 | | 150 day DMA | 13.4 | | 200 day DMA | 13.22 | EMA (exponential moving average) of Chimera Investment CIM
| EMA period | EMA current | EMA prev | EMA prev2 | | 5 day EMA | 12.86 | 12.81 | 12.79 | | 12 day EMA | 12.65 | 12.6 | 12.56 | | 20 day EMA | 12.59 | 12.55 | 12.52 | | 35 day EMA | 12.66 | 12.64 | 12.63 | | 50 day EMA | 12.83 | 12.82 | 12.82 |
SMA (simple moving average) of Chimera Investment CIM
| SMA period | SMA current | SMA prev | SMA prev2 | | 5 day SMA | 12.88 | 12.84 | 12.84 | | 12 day SMA | 12.56 | 12.47 | 12.39 | | 20 day SMA | 12.35 | 12.29 | 12.3 | | 35 day SMA | 12.55 | 12.54 | 12.54 | | 50 day SMA | 12.72 | 12.73 | 12.75 | | 100 day SMA | 13.32 | 13.33 | 13.34 | | 150 day SMA | 13.4 | 13.39 | 13.39 | | 200 day SMA | 13.22 | 13.23 | 13.23 |
|
|
