CompEn CIG full analysis,charts,indicators,moving averages,SMA,DMA,EMA,ADX,MACD,RSIComp En CIG WideScreen charts, DMA,SMA,EMA technical analysis, forecast prediction, by indicators ADX,MACD,RSI,CCI NYSE stock exchange
operates under Public Utilities sector & deals in Electric Utilities Central
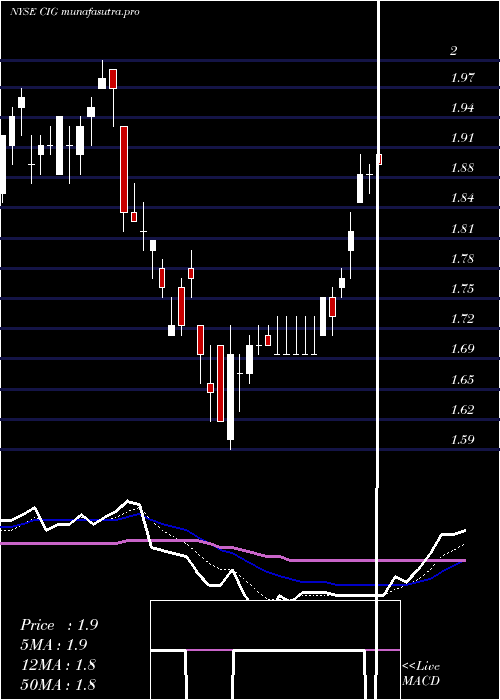
Daily price and charts and targets CompEn Strong Daily Stock price targets for CompEn CIG are 2.02 and 2.06 | Daily Target 1 | 1.99 | | Daily Target 2 | 2.01 | | Daily Target 3 | 2.03 | | Daily Target 4 | 2.05 | | Daily Target 5 | 2.07 |
Daily price and volume Comp En
| Date |
Closing |
Open |
Range |
Volume |
Mon 20 October 2025 |
2.03 (1.5%) |
2.01 |
2.01 - 2.05 |
1.2012 times |
Fri 17 October 2025 |
2.00 (2.56%) |
1.95 |
1.95 - 2.00 |
0.859 times |
Thu 16 October 2025 |
1.95 (0%) |
1.94 |
1.92 - 1.97 |
1.3182 times |
Wed 15 October 2025 |
1.95 (-0.51%) |
1.96 |
1.93 - 1.97 |
1.2622 times |
Tue 14 October 2025 |
1.96 (1.03%) |
1.93 |
1.92 - 1.97 |
1.1332 times |
Mon 13 October 2025 |
1.94 (-0.51%) |
1.95 |
1.92 - 1.96 |
0.9841 times |
Tue 07 October 2025 |
1.95 (-3.47%) |
2.00 |
1.95 - 2.00 |
0.9564 times |
Mon 06 October 2025 |
2.02 (-0.98%) |
2.06 |
1.99 - 2.06 |
0.6158 times |
Fri 03 October 2025 |
2.04 (0%) |
2.04 |
2.03 - 2.06 |
0.7171 times |
Thu 02 October 2025 |
2.04 (0%) |
2.10 |
2.00 - 2.10 |
0.9528 times |
Wed 01 October 2025 |
2.04 (-3.32%) |
2.11 |
2.03 - 2.11 |
0.9326 times |
Weekly price and charts CompEn Strong weekly Stock price targets for CompEn CIG are 2.02 and 2.06 | Weekly Target 1 | 1.99 | | Weekly Target 2 | 2.01 | | Weekly Target 3 | 2.03 | | Weekly Target 4 | 2.05 | | Weekly Target 5 | 2.07 |
Weekly price and volumes for Comp En
| Date |
Closing |
Open |
Range |
Volume |
Mon 20 October 2025 |
2.03 (1.5%) |
2.01 |
2.01 - 2.05 |
0.3786 times |
Fri 17 October 2025 |
2.00 (2.56%) |
1.95 |
1.92 - 2.00 |
1.7513 times |
Tue 07 October 2025 |
1.95 (-4.41%) |
2.06 |
1.95 - 2.06 |
0.4955 times |
Fri 03 October 2025 |
2.04 (-1.92%) |
2.09 |
2.00 - 2.13 |
1.3252 times |
Fri 26 September 2025 |
2.08 (0%) |
2.08 |
2.04 - 2.15 |
1.1393 times |
Fri 19 September 2025 |
2.08 (1.96%) |
2.05 |
2.04 - 2.13 |
1.3695 times |
Fri 12 September 2025 |
2.04 (0%) |
2.04 |
2.00 - 2.05 |
0.8804 times |
Fri 05 September 2025 |
2.04 (0.49%) |
1.97 |
1.96 - 2.07 |
1.1267 times |
Fri 29 August 2025 |
2.03 (0%) |
2.04 |
2.02 - 2.04 |
0.1678 times |
Fri 29 August 2025 |
2.03 (2.53%) |
1.97 |
1.96 - 2.05 |
1.3658 times |
Fri 22 August 2025 |
1.98 (1.54%) |
1.96 |
1.88 - 1.98 |
1.1258 times |
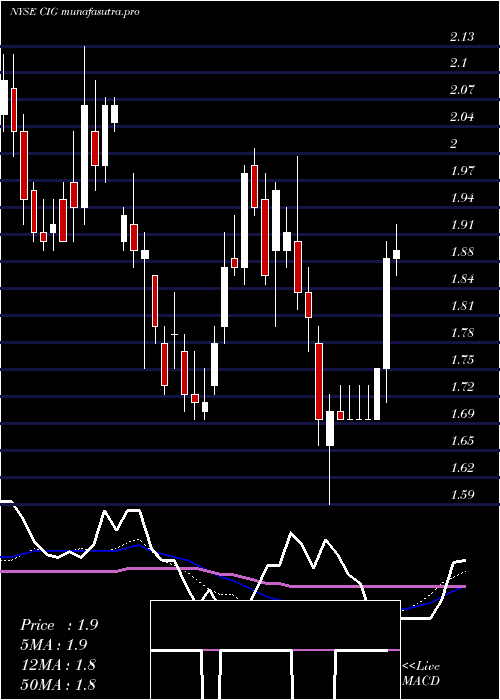
Monthly price and charts CompEn Strong monthly Stock price targets for CompEn CIG are 1.88 and 2.07 | Monthly Target 1 | 1.83 | | Monthly Target 2 | 1.93 | | Monthly Target 3 | 2.02 | | Monthly Target 4 | 2.12 | | Monthly Target 5 | 2.21 |
Monthly price and volumes Comp En
| Date |
Closing |
Open |
Range |
Volume |
Mon 20 October 2025 |
2.03 (-3.79%) |
2.11 |
1.92 - 2.11 |
0.586 times |
Tue 30 September 2025 |
2.11 (3.94%) |
1.97 |
1.96 - 2.15 |
0.8539 times |
Fri 29 August 2025 |
2.03 (12.15%) |
1.86 |
1.80 - 2.05 |
0.9279 times |
Thu 31 July 2025 |
1.81 (-7.65%) |
1.96 |
1.79 - 2.02 |
0.9772 times |
Mon 30 June 2025 |
1.96 (4.81%) |
1.88 |
1.81 - 1.97 |
1.1065 times |
Fri 30 May 2025 |
1.87 (-1.06%) |
1.90 |
1.75 - 1.93 |
1.2383 times |
Wed 30 April 2025 |
1.89 (7.39%) |
1.71 |
1.59 - 1.92 |
1.0641 times |
Mon 31 March 2025 |
1.76 (-5.38%) |
1.89 |
1.75 - 2.00 |
1.8891 times |
Fri 28 February 2025 |
1.86 (-0.53%) |
1.88 |
1.85 - 2.01 |
0.5964 times |
Fri 31 January 2025 |
1.87 (5.65%) |
1.78 |
1.69 - 1.91 |
0.7605 times |
Tue 31 December 2024 |
1.77 (-14.08%) |
1.90 |
1.75 - 1.98 |
0.6351 times |

DMA SMA EMA moving averages of Comp En CIG
DMA (daily moving average) of Comp En CIG
| DMA period | DMA value | | 5 day DMA | 1.98 | | 12 day DMA | 2 | | 20 day DMA | 2.04 | | 35 day DMA | 2.04 | | 50 day DMA | 2.01 | | 100 day DMA | 1.95 | | 150 day DMA | 1.9 | | 200 day DMA | 1.89 | EMA (exponential moving average) of Comp En CIG
| EMA period | EMA current | EMA prev | EMA prev2 | | 5 day EMA | 1.99 | 1.97 | 1.96 | | 12 day EMA | 2 | 1.99 | 1.99 | | 20 day EMA | 2.01 | 2.01 | 2.01 | | 35 day EMA | 2.02 | 2.02 | 2.02 | | 50 day EMA | 2 | 2 | 2 |
SMA (simple moving average) of Comp En CIG
| SMA period | SMA current | SMA prev | SMA prev2 | | 5 day SMA | 1.98 | 1.96 | 1.95 | | 12 day SMA | 2 | 2.01 | 2.02 | | 20 day SMA | 2.04 | 2.04 | 2.05 | | 35 day SMA | 2.04 | 2.04 | 2.04 | | 50 day SMA | 2.01 | 2.01 | 2.01 | | 100 day SMA | 1.95 | 1.95 | 1.94 | | 150 day SMA | 1.9 | 1.9 | 1.9 | | 200 day SMA | 1.89 | 1.89 | 1.89 |
|
|
