ColonialIntermediate CIF full analysis,charts,indicators,moving averages,SMA,DMA,EMA,ADX,MACD,RSIColonial Intermediate CIF WideScreen charts, DMA,SMA,EMA technical analysis, forecast prediction, by indicators ADX,MACD,RSI,CCI NYSE stock exchange
operates under N A sector & deals in N A
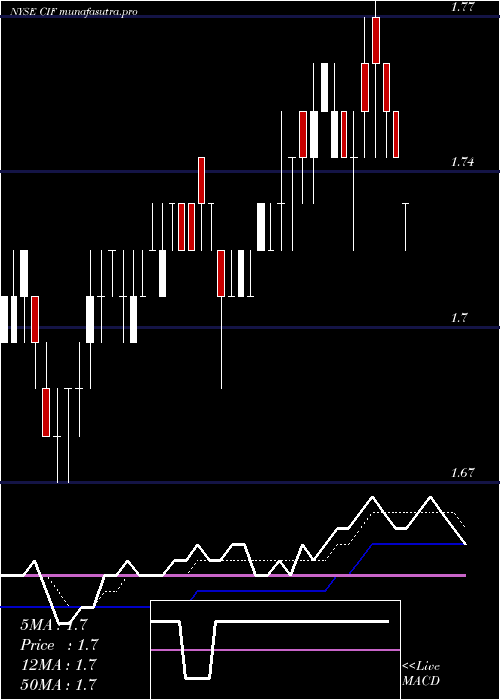
Daily price and charts and targets ColonialIntermediate Strong Daily Stock price targets for ColonialIntermediate CIF are 1.75 and 1.77 | Daily Target 1 | 1.74 | | Daily Target 2 | 1.75 | | Daily Target 3 | 1.76 | | Daily Target 4 | 1.77 | | Daily Target 5 | 1.78 |
Daily price and volume Colonial Intermediate
| Date |
Closing |
Open |
Range |
Volume |
Fri 05 December 2025 |
1.76 (0.57%) |
1.76 |
1.75 - 1.77 |
2.8591 times |
Thu 04 December 2025 |
1.75 (0.57%) |
1.73 |
1.73 - 1.76 |
0.9796 times |
Wed 03 December 2025 |
1.74 (0%) |
1.75 |
1.73 - 1.75 |
0.8627 times |
Tue 02 December 2025 |
1.74 (0%) |
1.72 |
1.72 - 1.74 |
1.292 times |
Mon 01 December 2025 |
1.74 (0%) |
1.72 |
1.72 - 1.75 |
0.5724 times |
Fri 28 November 2025 |
1.74 (0.58%) |
1.75 |
1.72 - 1.75 |
0.4816 times |
Wed 26 November 2025 |
1.73 (0.58%) |
1.73 |
1.72 - 1.74 |
1.1516 times |
Tue 25 November 2025 |
1.72 (1.18%) |
1.71 |
1.68 - 1.72 |
1.003 times |
Mon 24 November 2025 |
1.70 (0%) |
1.70 |
1.69 - 1.70 |
0.1981 times |
Fri 21 November 2025 |
1.70 (1.19%) |
1.68 |
1.68 - 1.70 |
0.5999 times |
Thu 20 November 2025 |
1.68 (-1.18%) |
1.71 |
1.68 - 1.71 |
0.5985 times |
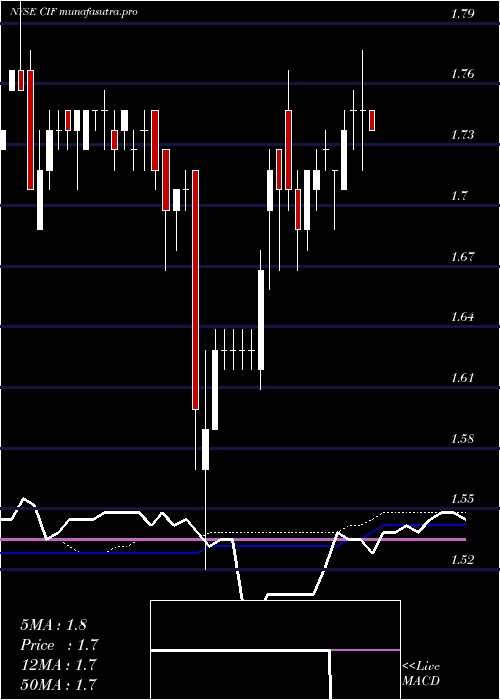
Weekly price and charts ColonialIntermediate Strong weekly Stock price targets for ColonialIntermediate CIF are 1.74 and 1.79 | Weekly Target 1 | 1.7 | | Weekly Target 2 | 1.73 | | Weekly Target 3 | 1.75 | | Weekly Target 4 | 1.78 | | Weekly Target 5 | 1.8 |
Weekly price and volumes for Colonial Intermediate
| Date |
Closing |
Open |
Range |
Volume |
Fri 05 December 2025 |
1.76 (1.15%) |
1.72 |
1.72 - 1.77 |
2.1277 times |
Fri 28 November 2025 |
1.74 (2.35%) |
1.70 |
1.68 - 1.75 |
0.9185 times |
Fri 21 November 2025 |
1.70 (-0.58%) |
1.70 |
1.68 - 1.73 |
0.9154 times |
Fri 14 November 2025 |
1.71 (-0.58%) |
1.73 |
1.68 - 1.75 |
0.8569 times |
Fri 07 November 2025 |
1.72 (-1.15%) |
1.72 |
1.71 - 1.74 |
1.0456 times |
Fri 31 October 2025 |
1.74 (0%) |
1.74 |
1.72 - 1.74 |
0.1757 times |
Fri 31 October 2025 |
1.74 (1.16%) |
1.75 |
1.71 - 1.75 |
1.4134 times |
Fri 24 October 2025 |
1.72 (0.58%) |
1.70 |
1.70 - 1.74 |
1.1178 times |
Fri 17 October 2025 |
1.71 (-3.93%) |
1.75 |
1.69 - 1.77 |
1.165 times |
Tue 07 October 2025 |
1.78 (1.71%) |
1.75 |
1.73 - 1.78 |
0.2641 times |
Fri 03 October 2025 |
1.75 (-1.69%) |
1.80 |
1.75 - 1.80 |
0.7078 times |
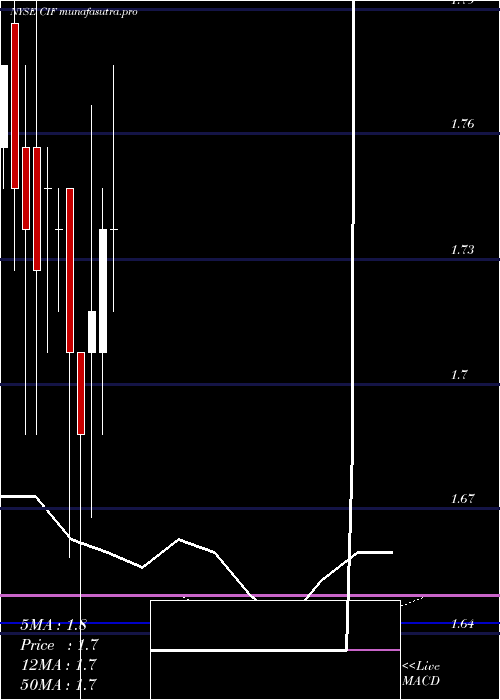
Monthly price and charts ColonialIntermediate Strong monthly Stock price targets for ColonialIntermediate CIF are 1.74 and 1.79 | Monthly Target 1 | 1.7 | | Monthly Target 2 | 1.73 | | Monthly Target 3 | 1.75 | | Monthly Target 4 | 1.78 | | Monthly Target 5 | 1.8 |
Monthly price and volumes Colonial Intermediate
| Date |
Closing |
Open |
Range |
Volume |
Fri 05 December 2025 |
1.76 (1.15%) |
1.72 |
1.72 - 1.77 |
0.428 times |
Fri 28 November 2025 |
1.74 (0%) |
1.72 |
1.68 - 1.75 |
0.7516 times |
Fri 31 October 2025 |
1.74 (-1.69%) |
1.77 |
1.69 - 1.79 |
0.9034 times |
Tue 30 September 2025 |
1.77 (1.14%) |
1.74 |
1.74 - 1.82 |
0.7077 times |
Fri 29 August 2025 |
1.75 (-0.57%) |
1.74 |
1.72 - 1.77 |
0.98 times |
Thu 31 July 2025 |
1.76 (1.15%) |
1.74 |
1.72 - 1.78 |
0.5555 times |
Mon 30 June 2025 |
1.74 (1.16%) |
1.71 |
1.69 - 1.75 |
0.4996 times |
Fri 30 May 2025 |
1.72 (1.78%) |
1.71 |
1.67 - 1.77 |
0.9039 times |
Wed 30 April 2025 |
1.69 (-1.17%) |
1.71 |
1.52 - 1.71 |
1.3956 times |
Mon 31 March 2025 |
1.71 (-1.72%) |
1.75 |
1.66 - 1.75 |
2.8747 times |
Fri 28 February 2025 |
1.74 (-0.57%) |
1.74 |
1.72 - 1.75 |
2.5931 times |
DMA SMA EMA moving averages of Colonial Intermediate CIF
DMA (daily moving average) of Colonial Intermediate CIF
| DMA period | DMA value | | 5 day DMA | 1.75 | | 12 day DMA | 1.73 | | 20 day DMA | 1.72 | | 35 day DMA | 1.73 | | 50 day DMA | 1.74 | | 100 day DMA | 1.75 | | 150 day DMA | 1.74 | | 200 day DMA | 1.72 | EMA (exponential moving average) of Colonial Intermediate CIF
| EMA period | EMA current | EMA prev | EMA prev2 | | 5 day EMA | 1.75 | 1.74 | 1.73 | | 12 day EMA | 1.73 | 1.72 | 1.72 | | 20 day EMA | 1.74 | 1.74 | 1.74 | | 35 day EMA | 1.75 | 1.75 | 1.75 | | 50 day EMA | 1.74 | 1.74 | 1.74 |
SMA (simple moving average) of Colonial Intermediate CIF
| SMA period | SMA current | SMA prev | SMA prev2 | | 5 day SMA | 1.75 | 1.74 | 1.74 | | 12 day SMA | 1.73 | 1.72 | 1.72 | | 20 day SMA | 1.72 | 1.72 | 1.72 | | 35 day SMA | 1.73 | 1.72 | 1.72 | | 50 day SMA | 1.74 | 1.74 | 1.74 | | 100 day SMA | 1.75 | 1.75 | 1.75 | | 150 day SMA | 1.74 | 1.74 | 1.73 | | 200 day SMA | 1.72 | 1.72 | 1.72 |
|
|
