CienaCorporation CIEN full analysis,charts,indicators,moving averages,SMA,DMA,EMA,ADX,MACD,RSICiena Corporation CIEN WideScreen charts, DMA,SMA,EMA technical analysis, forecast prediction, by indicators ADX,MACD,RSI,CCI NYSE stock exchange
operates under Public Utilities sector & deals in Telecommunications Equipment
Daily price and charts and targets CienaCorporation Strong Daily Stock price targets for CienaCorporation CIEN are 166.93 and 171.9 | Daily Target 1 | 166 | | Daily Target 2 | 167.85 | | Daily Target 3 | 170.96666666667 | | Daily Target 4 | 172.82 | | Daily Target 5 | 175.94 |
Daily price and volume Ciena Corporation
| Date |
Closing |
Open |
Range |
Volume |
Tue 21 October 2025 |
169.71 (-1.97%) |
172.81 |
169.11 - 174.08 |
0.9018 times |
Mon 20 October 2025 |
173.12 (1.27%) |
173.63 |
171.95 - 177.79 |
0.8703 times |
Fri 17 October 2025 |
170.95 (0.1%) |
169.48 |
165.08 - 173.06 |
0.8507 times |
Thu 16 October 2025 |
170.78 (1.23%) |
170.43 |
170.05 - 176.88 |
1.1318 times |
Wed 15 October 2025 |
168.71 (2.36%) |
168.99 |
166.89 - 172.92 |
1.0394 times |
Tue 14 October 2025 |
164.82 (0.02%) |
161.55 |
159.01 - 167.28 |
0.7524 times |
Mon 13 October 2025 |
164.78 (5.67%) |
164.00 |
160.10 - 167.34 |
1.2484 times |
Fri 10 October 2025 |
155.94 (-4.69%) |
165.24 |
153.27 - 165.24 |
1.3239 times |
Thu 09 October 2025 |
163.61 (2.47%) |
158.13 |
157.16 - 164.02 |
1.0239 times |
Wed 08 October 2025 |
159.66 (5.4%) |
152.70 |
152.55 - 159.85 |
0.8574 times |
Tue 07 October 2025 |
151.48 (-1.15%) |
154.00 |
147.36 - 155.20 |
1.1764 times |
Weekly price and charts CienaCorporation Strong weekly Stock price targets for CienaCorporation CIEN are 165.07 and 173.75 | Weekly Target 1 | 163.52 | | Weekly Target 2 | 166.62 | | Weekly Target 3 | 172.20333333333 | | Weekly Target 4 | 175.3 | | Weekly Target 5 | 180.88 |
Weekly price and volumes for Ciena Corporation
| Date |
Closing |
Open |
Range |
Volume |
Tue 21 October 2025 |
169.71 (-0.73%) |
173.63 |
169.11 - 177.79 |
0.3471 times |
Fri 17 October 2025 |
170.95 (9.63%) |
164.00 |
159.01 - 176.88 |
0.9839 times |
Fri 10 October 2025 |
155.94 (2.96%) |
153.45 |
147.36 - 165.24 |
1.0385 times |
Fri 03 October 2025 |
151.45 (6.71%) |
145.81 |
143.00 - 154.36 |
0.9047 times |
Fri 26 September 2025 |
141.93 (2.57%) |
138.06 |
133.67 - 143.79 |
1.2234 times |
Fri 19 September 2025 |
138.37 (5.4%) |
132.00 |
131.45 - 139.74 |
1.2445 times |
Fri 12 September 2025 |
131.28 (12.5%) |
118.45 |
117.02 - 134.31 |
1.2136 times |
Fri 05 September 2025 |
116.69 (24.18%) |
92.68 |
90.00 - 122.00 |
2.0473 times |
Fri 29 August 2025 |
93.97 (0%) |
97.25 |
93.47 - 97.54 |
0.1891 times |
Fri 29 August 2025 |
93.97 (4.63%) |
90.12 |
89.41 - 98.88 |
0.8078 times |
Fri 22 August 2025 |
89.81 (-1.17%) |
90.46 |
84.41 - 92.21 |
0.6806 times |
Monthly price and charts CienaCorporation Strong monthly Stock price targets for CienaCorporation CIEN are 156.45 and 191.05 | Monthly Target 1 | 128.96 | | Monthly Target 2 | 149.34 | | Monthly Target 3 | 163.56333333333 | | Monthly Target 4 | 183.94 | | Monthly Target 5 | 198.16 |
Monthly price and volumes Ciena Corporation
| Date |
Closing |
Open |
Range |
Volume |
Tue 21 October 2025 |
169.71 (16.5%) |
144.24 |
143.19 - 177.79 |
0.7257 times |
Tue 30 September 2025 |
145.67 (55.02%) |
92.68 |
90.00 - 146.53 |
1.5268 times |
Fri 29 August 2025 |
93.97 (1.22%) |
90.16 |
84.41 - 98.88 |
0.7752 times |
Thu 31 July 2025 |
92.84 (14.15%) |
80.50 |
76.89 - 95.51 |
0.9175 times |
Mon 30 June 2025 |
81.33 (1.59%) |
80.15 |
70.77 - 86.21 |
1.2582 times |
Fri 30 May 2025 |
80.06 (19.21%) |
69.50 |
69.06 - 83.49 |
0.6277 times |
Wed 30 April 2025 |
67.16 (11.14%) |
60.51 |
49.21 - 67.56 |
0.8895 times |
Mon 31 March 2025 |
60.43 (-24.05%) |
79.50 |
58.04 - 80.55 |
1.1864 times |
Fri 28 February 2025 |
79.57 (-8.69%) |
83.41 |
75.61 - 94.79 |
0.8667 times |
Fri 31 January 2025 |
87.14 (2.75%) |
85.07 |
74.89 - 101.44 |
1.2263 times |
Tue 31 December 2024 |
84.81 (19.69%) |
69.55 |
69.20 - 91.82 |
1.0259 times |

DMA SMA EMA moving averages of Ciena Corporation CIEN
DMA (daily moving average) of Ciena Corporation CIEN
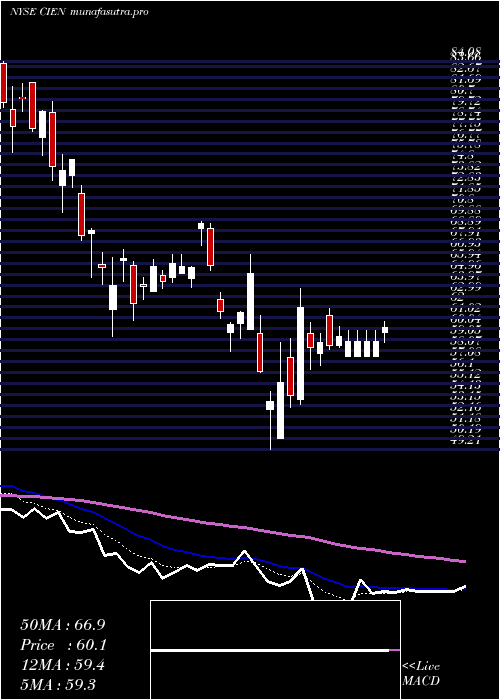
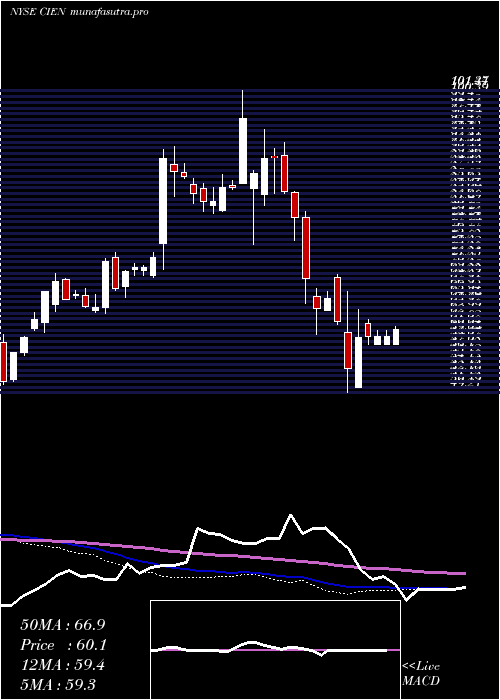
| DMA period | DMA value | | 5 day DMA | 170.65 | | 12 day DMA | 163.9 | | 20 day DMA | 156.5 | | 35 day DMA | 144.52 | | 50 day DMA | 128.68 | | 100 day DMA | 105.62 | | 150 day DMA | 92.99 | | 200 day DMA | 90.2 | EMA (exponential moving average) of Ciena Corporation CIEN
| EMA period | EMA current | EMA prev | EMA prev2 | | 5 day EMA | 169.57 | 169.5 | 167.69 | | 12 day EMA | 163.95 | 162.9 | 161.04 | | 20 day EMA | 157.05 | 155.72 | 153.89 | | 35 day EMA | 143.41 | 141.86 | 140.02 | | 50 day EMA | 130.09 | 128.47 | 126.65 |
SMA (simple moving average) of Ciena Corporation CIEN
| SMA period | SMA current | SMA prev | SMA prev2 | | 5 day SMA | 170.65 | 169.68 | 168.01 | | 12 day SMA | 163.9 | 162.38 | 160.67 | | 20 day SMA | 156.5 | 154.99 | 153.3 | | 35 day SMA | 144.52 | 142.34 | 140.08 | | 50 day SMA | 128.68 | 127.21 | 125.62 | | 100 day SMA | 105.62 | 104.75 | 103.84 | | 150 day SMA | 92.99 | 92.29 | 91.56 | | 200 day SMA | 90.2 | 89.77 | 89.32 |
|
|
