CommunityHealthcare CHCT full analysis,charts,indicators,moving averages,SMA,DMA,EMA,ADX,MACD,RSICommunity Healthcare CHCT WideScreen charts, DMA,SMA,EMA technical analysis, forecast prediction, by indicators ADX,MACD,RSI,CCI NYSE stock exchange
operates under Consumer Services sector & deals in Real Estate Investment Trusts
Daily price and charts and targets CommunityHealthcare Strong Daily Stock price targets for CommunityHealthcare CHCT are 13.65 and 14.03 | Daily Target 1 | 13.57 | | Daily Target 2 | 13.72 | | Daily Target 3 | 13.953333333333 | | Daily Target 4 | 14.1 | | Daily Target 5 | 14.33 |
Daily price and volume Community Healthcare
| Date |
Closing |
Open |
Range |
Volume |
Fri 17 October 2025 |
13.86 (-1.07%) |
13.96 |
13.81 - 14.19 |
0.7973 times |
Thu 16 October 2025 |
14.01 (-0.78%) |
14.06 |
13.91 - 14.22 |
1.0043 times |
Wed 15 October 2025 |
14.12 (1.36%) |
13.91 |
13.85 - 14.12 |
0.8987 times |
Tue 14 October 2025 |
13.93 (2.73%) |
13.48 |
13.48 - 13.94 |
1.0069 times |
Mon 13 October 2025 |
13.56 (1.88%) |
13.40 |
13.23 - 13.59 |
0.8868 times |
Fri 10 October 2025 |
13.31 (-2.49%) |
13.65 |
13.31 - 13.72 |
1.104 times |
Thu 09 October 2025 |
13.65 (-1.94%) |
13.83 |
13.51 - 13.94 |
1.1722 times |
Wed 08 October 2025 |
13.92 (-1.42%) |
14.06 |
13.89 - 14.14 |
1.0576 times |
Tue 07 October 2025 |
14.12 (-2.55%) |
14.50 |
14.12 - 14.50 |
1.0299 times |
Mon 06 October 2025 |
14.49 (-3.53%) |
15.00 |
14.48 - 15.05 |
1.0423 times |
Fri 03 October 2025 |
15.02 (-0.13%) |
15.09 |
15.01 - 15.30 |
0.7177 times |
Weekly price and charts CommunityHealthcare Strong weekly Stock price targets for CommunityHealthcare CHCT are 13.55 and 14.54 | Weekly Target 1 | 12.78 | | Weekly Target 2 | 13.32 | | Weekly Target 3 | 13.77 | | Weekly Target 4 | 14.31 | | Weekly Target 5 | 14.76 |
Weekly price and volumes for Community Healthcare
| Date |
Closing |
Open |
Range |
Volume |
Fri 17 October 2025 |
13.86 (4.13%) |
13.40 |
13.23 - 14.22 |
1.2122 times |
Fri 10 October 2025 |
13.31 (-11.38%) |
15.00 |
13.31 - 15.05 |
1.4264 times |
Fri 03 October 2025 |
15.02 (-0.2%) |
15.03 |
14.94 - 15.48 |
0.9593 times |
Fri 26 September 2025 |
15.05 (0.2%) |
15.07 |
14.85 - 15.31 |
1.0492 times |
Fri 19 September 2025 |
15.02 (-4.21%) |
15.84 |
14.98 - 15.84 |
1.4762 times |
Fri 12 September 2025 |
15.68 (0.13%) |
15.61 |
15.42 - 15.83 |
0.8538 times |
Fri 05 September 2025 |
15.66 (1.62%) |
15.34 |
15.02 - 15.79 |
0.8051 times |
Fri 29 August 2025 |
15.41 (0%) |
15.22 |
15.18 - 15.43 |
0.1705 times |
Fri 29 August 2025 |
15.41 (1.92%) |
15.08 |
14.93 - 15.43 |
0.9017 times |
Fri 22 August 2025 |
15.12 (5.37%) |
14.37 |
14.25 - 15.28 |
1.1457 times |
Fri 15 August 2025 |
14.35 (-0.62%) |
14.46 |
14.20 - 15.01 |
1.402 times |

Monthly price and charts CommunityHealthcare Strong monthly Stock price targets for CommunityHealthcare CHCT are 12.42 and 14.67 | Monthly Target 1 | 11.94 | | Monthly Target 2 | 12.9 | | Monthly Target 3 | 14.19 | | Monthly Target 4 | 15.15 | | Monthly Target 5 | 16.44 |
Monthly price and volumes Community Healthcare
| Date |
Closing |
Open |
Range |
Volume |
Fri 17 October 2025 |
13.86 (-9.41%) |
15.24 |
13.23 - 15.48 |
0.6152 times |
Tue 30 September 2025 |
15.30 (-0.71%) |
15.34 |
14.85 - 15.84 |
0.8802 times |
Fri 29 August 2025 |
15.41 (0.26%) |
15.44 |
14.20 - 15.69 |
1.2113 times |
Thu 31 July 2025 |
15.37 (-7.58%) |
16.66 |
15.22 - 17.62 |
1.2934 times |
Mon 30 June 2025 |
16.63 (1.77%) |
16.43 |
16.16 - 17.48 |
1.07 times |
Fri 30 May 2025 |
16.34 (-4.33%) |
17.14 |
15.62 - 17.29 |
0.9142 times |
Wed 30 April 2025 |
17.08 (-5.95%) |
18.20 |
14.76 - 18.42 |
1.0599 times |
Mon 31 March 2025 |
18.16 (-3.09%) |
18.67 |
17.81 - 19.01 |
0.9917 times |
Fri 28 February 2025 |
18.74 (-5.5%) |
19.59 |
18.16 - 20.28 |
1.0598 times |
Fri 31 January 2025 |
19.83 (3.23%) |
19.25 |
18.45 - 20.87 |
0.9043 times |
Tue 31 December 2024 |
19.21 (4.52%) |
18.76 |
17.79 - 19.22 |
1.0258 times |

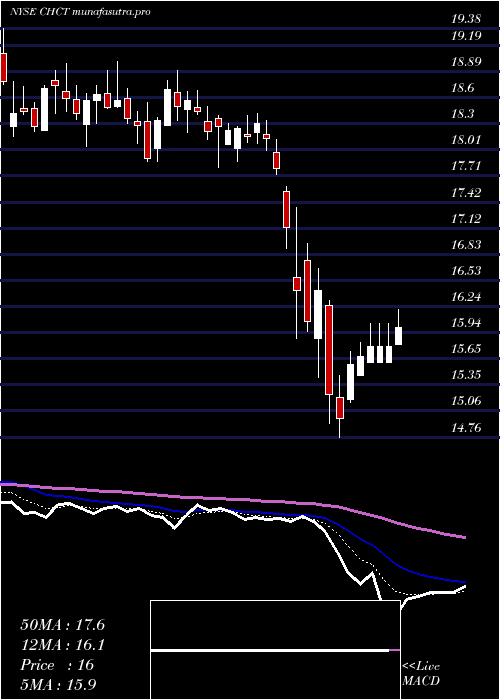
DMA SMA EMA moving averages of Community Healthcare CHCT
DMA (daily moving average) of Community Healthcare CHCT
| DMA period | DMA value | | 5 day DMA | 13.9 | | 12 day DMA | 14.09 | | 20 day DMA | 14.5 | | 35 day DMA | 14.91 | | 50 day DMA | 14.9 | | 100 day DMA | 15.69 | | 150 day DMA | 16.07 | | 200 day DMA | 16.87 | EMA (exponential moving average) of Community Healthcare CHCT
| EMA period | EMA current | EMA prev | EMA prev2 | | 5 day EMA | 13.92 | 13.95 | 13.92 | | 12 day EMA | 14.12 | 14.17 | 14.2 | | 20 day EMA | 14.37 | 14.42 | 14.46 | | 35 day EMA | 14.59 | 14.63 | 14.67 | | 50 day EMA | 14.83 | 14.87 | 14.9 |
SMA (simple moving average) of Community Healthcare CHCT
| SMA period | SMA current | SMA prev | SMA prev2 | | 5 day SMA | 13.9 | 13.79 | 13.71 | | 12 day SMA | 14.09 | 14.21 | 14.32 | | 20 day SMA | 14.5 | 14.56 | 14.63 | | 35 day SMA | 14.91 | 14.95 | 14.99 | | 50 day SMA | 14.9 | 14.91 | 14.94 | | 100 day SMA | 15.69 | 15.71 | 15.73 | | 150 day SMA | 16.07 | 16.1 | 16.12 | | 200 day SMA | 16.87 | 16.9 | 16.92 |
|
|
