CfIndustries CF full analysis,charts,indicators,moving averages,SMA,DMA,EMA,ADX,MACD,RSICf Industries CF WideScreen charts, DMA,SMA,EMA technical analysis, forecast prediction, by indicators ADX,MACD,RSI,CCI NYSE stock exchange
operates under Basic Industries sector & deals in Agricultural Chemicals
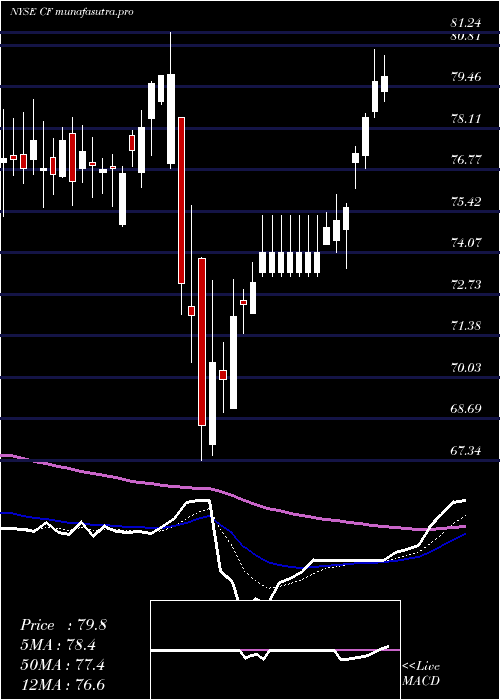
Daily price and charts and targets CfIndustries Strong Daily Stock price targets for CfIndustries CF are 82.4 and 84.15 | Daily Target 1 | 82.1 | | Daily Target 2 | 82.7 | | Daily Target 3 | 83.853333333333 | | Daily Target 4 | 84.45 | | Daily Target 5 | 85.6 |
Daily price and volume Cf Industries
| Date |
Closing |
Open |
Range |
Volume |
Tue 21 October 2025 |
83.29 (-0.76%) |
84.50 |
83.26 - 85.01 |
1.376 times |
Mon 20 October 2025 |
83.93 (0.5%) |
83.78 |
83.44 - 84.54 |
0.8726 times |
Fri 17 October 2025 |
83.51 (0.59%) |
82.47 |
82.28 - 84.04 |
1.1358 times |
Thu 16 October 2025 |
83.02 (-2.83%) |
85.99 |
82.35 - 87.48 |
1.5108 times |
Wed 15 October 2025 |
85.44 (-1.49%) |
86.99 |
85.22 - 87.61 |
0.8299 times |
Tue 14 October 2025 |
86.73 (-1.68%) |
88.03 |
85.42 - 88.42 |
0.8775 times |
Mon 13 October 2025 |
88.21 (1%) |
87.56 |
87.54 - 88.53 |
0.6115 times |
Fri 10 October 2025 |
87.34 (-1.43%) |
87.23 |
86.51 - 88.78 |
1.0509 times |
Thu 09 October 2025 |
88.61 (-2.29%) |
91.53 |
88.55 - 91.63 |
0.8086 times |
Wed 08 October 2025 |
90.69 (-1.39%) |
92.50 |
89.98 - 92.51 |
0.9263 times |
Tue 07 October 2025 |
91.97 (-0.1%) |
91.86 |
91.01 - 92.23 |
0.9682 times |
Weekly price and charts CfIndustries Strong weekly Stock price targets for CfIndustries CF are 82.4 and 84.15 | Weekly Target 1 | 82.1 | | Weekly Target 2 | 82.7 | | Weekly Target 3 | 83.853333333333 | | Weekly Target 4 | 84.45 | | Weekly Target 5 | 85.6 |
Weekly price and volumes for Cf Industries
| Date |
Closing |
Open |
Range |
Volume |
Tue 21 October 2025 |
83.29 (-0.26%) |
83.78 |
83.26 - 85.01 |
0.427 times |
Fri 17 October 2025 |
83.51 (-4.39%) |
87.56 |
82.28 - 88.53 |
0.9429 times |
Fri 10 October 2025 |
87.34 (-3.05%) |
90.68 |
86.51 - 92.51 |
0.8734 times |
Fri 03 October 2025 |
90.09 (-2.21%) |
92.15 |
86.34 - 92.46 |
1.0691 times |
Fri 26 September 2025 |
92.13 (8.27%) |
85.03 |
84.43 - 93.08 |
1.6955 times |
Fri 19 September 2025 |
85.09 (-0.63%) |
85.84 |
83.14 - 86.27 |
1.642 times |
Fri 12 September 2025 |
85.63 (1.36%) |
85.19 |
83.53 - 87.39 |
0.9612 times |
Fri 05 September 2025 |
84.48 (-2.48%) |
86.59 |
81.72 - 87.61 |
1.1613 times |
Fri 29 August 2025 |
86.63 (0%) |
87.31 |
86.25 - 87.49 |
0.1378 times |
Fri 29 August 2025 |
86.63 (0.14%) |
86.68 |
84.90 - 88.84 |
1.0898 times |
Fri 22 August 2025 |
86.51 (0.71%) |
85.69 |
83.57 - 87.28 |
1.0243 times |
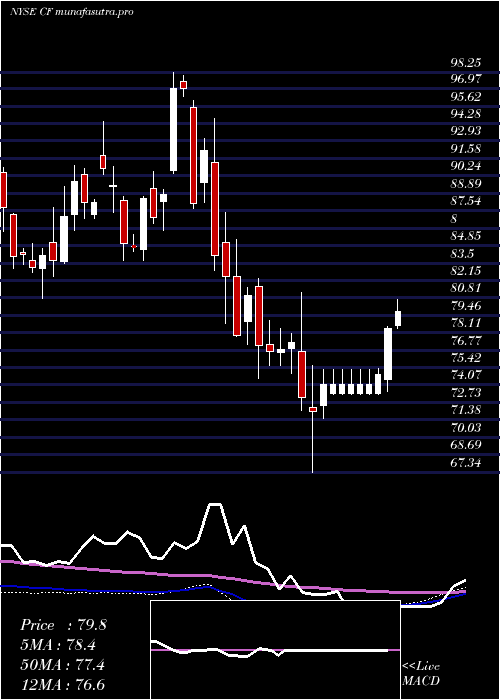
Monthly price and charts CfIndustries Strong monthly Stock price targets for CfIndustries CF are 77.67 and 87.9 | Monthly Target 1 | 75.8 | | Monthly Target 2 | 79.54 | | Monthly Target 3 | 86.026666666667 | | Monthly Target 4 | 89.77 | | Monthly Target 5 | 96.26 |
Monthly price and volumes Cf Industries
| Date |
Closing |
Open |
Range |
Volume |
Tue 21 October 2025 |
83.29 (-7.15%) |
89.67 |
82.28 - 92.51 |
0.5316 times |
Tue 30 September 2025 |
89.70 (3.54%) |
86.59 |
81.72 - 93.08 |
1.1224 times |
Fri 29 August 2025 |
86.63 (-6.68%) |
92.80 |
79.64 - 94.08 |
1.1235 times |
Thu 31 July 2025 |
92.83 (0.9%) |
91.87 |
90.47 - 99.39 |
0.8827 times |
Mon 30 June 2025 |
92.00 (1.42%) |
91.33 |
90.08 - 102.88 |
1.2819 times |
Fri 30 May 2025 |
90.71 (15.75%) |
78.54 |
77.72 - 91.84 |
1.0286 times |
Wed 30 April 2025 |
78.37 (0.28%) |
78.45 |
67.34 - 81.24 |
1.0104 times |
Mon 31 March 2025 |
78.15 (-3.54%) |
81.70 |
74.59 - 82.28 |
1.0496 times |
Fri 28 February 2025 |
81.02 (-12.14%) |
91.24 |
77.21 - 94.64 |
1.135 times |
Fri 31 January 2025 |
92.21 (8.08%) |
86.00 |
85.44 - 98.25 |
0.8342 times |
Tue 31 December 2024 |
85.32 (-3.2%) |
91.77 |
83.66 - 94.43 |
0.4867 times |

DMA SMA EMA moving averages of Cf Industries CF
DMA (daily moving average) of Cf Industries CF
| DMA period | DMA value | | 5 day DMA | 83.84 | | 12 day DMA | 87.07 | | 20 day DMA | 88.24 | | 35 day DMA | 86.93 | | 50 day DMA | 86.68 | | 100 day DMA | 89.86 | | 150 day DMA | 86.3 | | 200 day DMA | 85.92 | EMA (exponential moving average) of Cf Industries CF
| EMA period | EMA current | EMA prev | EMA prev2 | | 5 day EMA | 84.22 | 84.68 | 85.06 | | 12 day EMA | 85.9 | 86.38 | 86.82 | | 20 day EMA | 86.59 | 86.94 | 87.26 | | 35 day EMA | 86.76 | 86.96 | 87.14 | | 50 day EMA | 86.15 | 86.27 | 86.37 |
SMA (simple moving average) of Cf Industries CF
| SMA period | SMA current | SMA prev | SMA prev2 | | 5 day SMA | 83.84 | 84.53 | 85.38 | | 12 day SMA | 87.07 | 87.63 | 88.13 | | 20 day SMA | 88.24 | 88.44 | 88.52 | | 35 day SMA | 86.93 | 87.05 | 87.13 | | 50 day SMA | 86.68 | 86.67 | 86.65 | | 100 day SMA | 89.86 | 89.94 | 90.02 | | 150 day SMA | 86.3 | 86.26 | 86.22 | | 200 day SMA | 85.92 | 85.94 | 85.96 |
|
|
