CelaneseCorporation CE full analysis,charts,indicators,moving averages,SMA,DMA,EMA,ADX,MACD,RSICelanese Corporation CE WideScreen charts, DMA,SMA,EMA technical analysis, forecast prediction, by indicators ADX,MACD,RSI,CCI NYSE stock exchange
operates under Basic Industries sector & deals in Major Chemicals
Daily price and charts and targets CelaneseCorporation Strong Daily Stock price targets for CelaneseCorporation CE are 41.14 and 42.57 | Daily Target 1 | 40.02 | | Daily Target 2 | 40.82 | | Daily Target 3 | 41.453333333333 | | Daily Target 4 | 42.25 | | Daily Target 5 | 42.88 |
Daily price and volume Celanese Corporation
| Date |
Closing |
Open |
Range |
Volume |
Tue 21 October 2025 |
41.61 (1.39%) |
41.02 |
40.66 - 42.09 |
0.7827 times |
Mon 20 October 2025 |
41.04 (2.11%) |
40.69 |
40.17 - 41.65 |
1.1497 times |
Fri 17 October 2025 |
40.19 (0.53%) |
39.76 |
39.35 - 40.23 |
1.1449 times |
Thu 16 October 2025 |
39.98 (-0.52%) |
40.53 |
39.57 - 40.80 |
0.8757 times |
Wed 15 October 2025 |
40.19 (-1.54%) |
41.38 |
40.15 - 41.81 |
0.995 times |
Tue 14 October 2025 |
40.82 (1.64%) |
39.24 |
38.85 - 41.13 |
0.7217 times |
Mon 13 October 2025 |
40.16 (2.21%) |
40.18 |
40.04 - 41.38 |
0.9061 times |
Fri 10 October 2025 |
39.29 (-6.92%) |
42.41 |
39.21 - 42.61 |
1.6929 times |
Thu 09 October 2025 |
42.21 (-0.99%) |
43.00 |
41.71 - 43.05 |
0.7681 times |
Wed 08 October 2025 |
42.63 (0.05%) |
42.94 |
42.52 - 43.30 |
0.9632 times |
Tue 07 October 2025 |
42.61 (-3.79%) |
44.73 |
42.46 - 44.89 |
1.131 times |
Weekly price and charts CelaneseCorporation Strong weekly Stock price targets for CelaneseCorporation CE are 40.89 and 42.81 | Weekly Target 1 | 39.37 | | Weekly Target 2 | 40.49 | | Weekly Target 3 | 41.29 | | Weekly Target 4 | 42.41 | | Weekly Target 5 | 43.21 |
Weekly price and volumes for Celanese Corporation
| Date |
Closing |
Open |
Range |
Volume |
Tue 21 October 2025 |
41.61 (3.53%) |
40.69 |
40.17 - 42.09 |
0.3812 times |
Fri 17 October 2025 |
40.19 (2.29%) |
40.18 |
38.85 - 41.81 |
0.9161 times |
Fri 10 October 2025 |
39.29 (-12.96%) |
45.20 |
39.21 - 45.20 |
1.0297 times |
Fri 03 October 2025 |
45.14 (10.69%) |
41.31 |
40.13 - 45.83 |
1.0801 times |
Fri 26 September 2025 |
40.78 (-7.84%) |
44.25 |
39.83 - 44.34 |
1.5553 times |
Fri 19 September 2025 |
44.25 (-2.96%) |
46.21 |
44.12 - 47.75 |
1.3213 times |
Fri 12 September 2025 |
45.60 (-6.42%) |
47.84 |
43.84 - 48.16 |
1.2298 times |
Fri 05 September 2025 |
48.73 (2.31%) |
46.65 |
43.71 - 49.33 |
1.0933 times |
Fri 29 August 2025 |
47.63 (0%) |
46.89 |
46.85 - 47.90 |
0.2398 times |
Fri 29 August 2025 |
47.63 (-2.06%) |
48.11 |
46.42 - 48.63 |
1.1533 times |
Fri 22 August 2025 |
48.63 (14.48%) |
42.06 |
42.00 - 48.86 |
1.4739 times |
Monthly price and charts CelaneseCorporation Strong monthly Stock price targets for CelaneseCorporation CE are 36.74 and 43.72 | Monthly Target 1 | 35.12 | | Monthly Target 2 | 38.36 | | Monthly Target 3 | 42.096666666667 | | Monthly Target 4 | 45.34 | | Monthly Target 5 | 49.08 |
Monthly price and volumes Celanese Corporation
| Date |
Closing |
Open |
Range |
Volume |
Tue 21 October 2025 |
41.61 (-1.12%) |
41.98 |
38.85 - 45.83 |
0.4329 times |
Tue 30 September 2025 |
42.08 (-11.65%) |
46.65 |
39.83 - 49.33 |
0.8229 times |
Fri 29 August 2025 |
47.63 (-8.81%) |
50.86 |
36.98 - 50.86 |
1.1092 times |
Thu 31 July 2025 |
52.23 (-5.6%) |
55.32 |
51.98 - 63.55 |
0.7304 times |
Mon 30 June 2025 |
55.33 (4.73%) |
52.81 |
51.34 - 60.36 |
0.5726 times |
Fri 30 May 2025 |
52.83 (18.69%) |
44.55 |
43.87 - 57.91 |
1.025 times |
Wed 30 April 2025 |
44.51 (-21.6%) |
56.64 |
36.29 - 56.98 |
1.2962 times |
Mon 31 March 2025 |
56.77 (11.44%) |
51.80 |
45.94 - 59.94 |
1.572 times |
Fri 28 February 2025 |
50.94 (-28.29%) |
69.03 |
49.22 - 71.83 |
1.5235 times |
Fri 31 January 2025 |
71.04 (2.64%) |
69.51 |
64.05 - 75.84 |
0.9153 times |
Tue 31 December 2024 |
69.21 (-5%) |
74.55 |
66.78 - 75.41 |
0.7991 times |
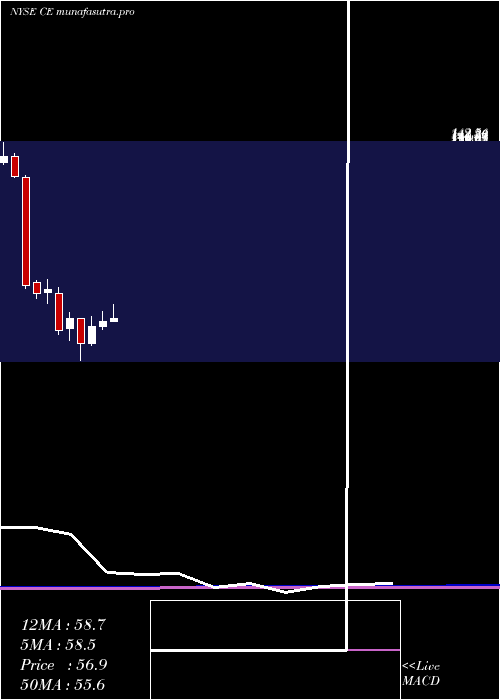
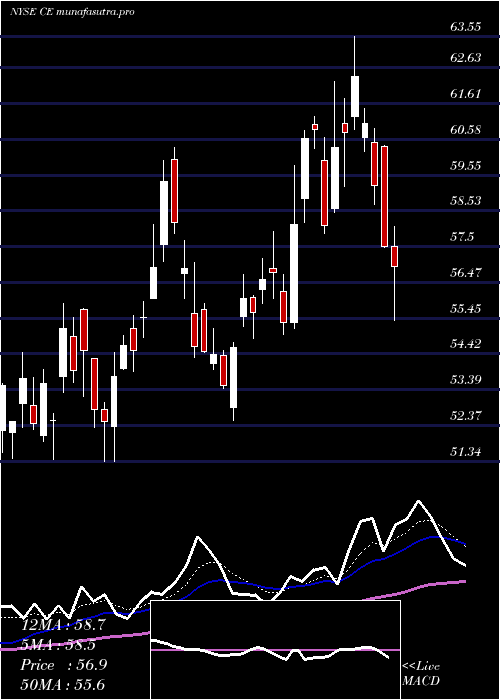
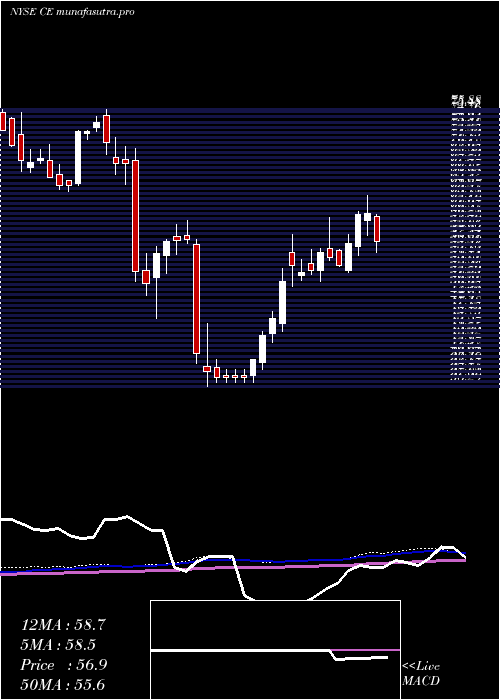
DMA SMA EMA moving averages of Celanese Corporation CE
DMA (daily moving average) of Celanese Corporation CE
| DMA period | DMA value | | 5 day DMA | 40.6 | | 12 day DMA | 41.25 | | 20 day DMA | 41.69 | | 35 day DMA | 43.22 | | 50 day DMA | 43.93 | | 100 day DMA | 49.74 | | 150 day DMA | 49.06 | | 200 day DMA | 52.61 | EMA (exponential moving average) of Celanese Corporation CE
| EMA period | EMA current | EMA prev | EMA prev2 | | 5 day EMA | 40.94 | 40.61 | 40.4 | | 12 day EMA | 41.27 | 41.21 | 41.24 | | 20 day EMA | 41.84 | 41.86 | 41.95 | | 35 day EMA | 42.8 | 42.87 | 42.98 | | 50 day EMA | 43.82 | 43.91 | 44.03 |
SMA (simple moving average) of Celanese Corporation CE
| SMA period | SMA current | SMA prev | SMA prev2 | | 5 day SMA | 40.6 | 40.44 | 40.27 | | 12 day SMA | 41.25 | 41.55 | 41.9 | | 20 day SMA | 41.69 | 41.74 | 41.87 | | 35 day SMA | 43.22 | 43.35 | 43.54 | | 50 day SMA | 43.93 | 43.92 | 44.05 | | 100 day SMA | 49.74 | 49.87 | 50.01 | | 150 day SMA | 49.06 | 49.17 | 49.28 | | 200 day SMA | 52.61 | 52.73 | 52.86 |
|
|
