ComcastCorporation CCZ full analysis,charts,indicators,moving averages,SMA,DMA,EMA,ADX,MACD,RSIComcast Corporation CCZ WideScreen charts, DMA,SMA,EMA technical analysis, forecast prediction, by indicators ADX,MACD,RSI,CCI NYSE stock exchange
operates under Consumer Services sector & deals in Television Services
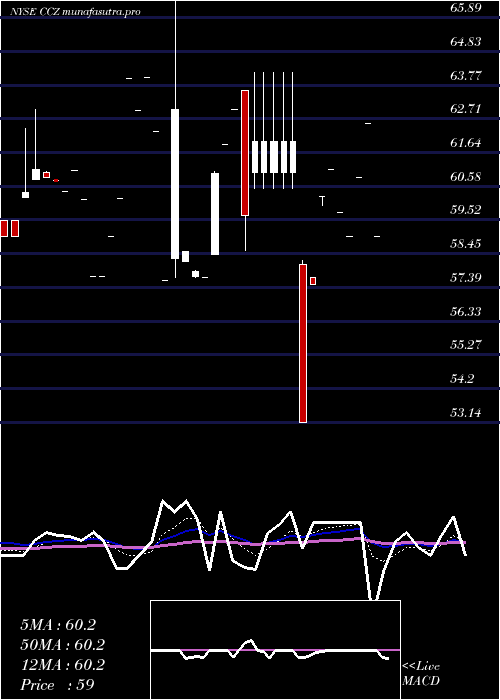
Daily price and charts and targets ComcastCorporation Strong Daily Stock price targets for ComcastCorporation CCZ are 59 and 59 | Daily Target 1 | 59 | | Daily Target 2 | 59 | | Daily Target 3 | 59 | | Daily Target 4 | 59 | | Daily Target 5 | 59 |
Daily price and volume Comcast Corporation
| Date |
Closing |
Open |
Range |
Volume |
Fri 17 October 2025 |
59.00 (-5.66%) |
59.00 |
59.00 - 59.00 |
0.4762 times |
Mon 15 September 2025 |
62.54 (2.78%) |
62.54 |
62.54 - 62.54 |
0.2381 times |
Fri 08 August 2025 |
60.85 (3.14%) |
60.85 |
60.85 - 60.85 |
0.9524 times |
Fri 01 August 2025 |
59.00 (-1.26%) |
59.00 |
59.00 - 59.00 |
0.7143 times |
Mon 14 July 2025 |
59.75 (-2.21%) |
59.75 |
59.75 - 59.75 |
0.2381 times |
Tue 27 May 2025 |
61.10 (1.41%) |
61.10 |
61.10 - 61.10 |
0.2381 times |
Tue 22 April 2025 |
60.25 (4.78%) |
60.25 |
59.99 - 60.25 |
0 times |
Mon 21 April 2025 |
57.50 (8.2%) |
57.70 |
57.50 - 57.70 |
1.6667 times |
Thu 17 April 2025 |
53.14 (-14.29%) |
58.10 |
53.14 - 58.25 |
5.4762 times |
Wed 16 April 2025 |
62.00 (0%) |
61.00 |
60.50 - 64.15 |
0 times |
Wed 16 April 2025 |
62.00 (0%) |
61.00 |
60.50 - 64.15 |
0 times |
Weekly price and charts ComcastCorporation Strong weekly Stock price targets for ComcastCorporation CCZ are 57.23 and 60.77 | Weekly Target 1 | 56.64 | | Weekly Target 2 | 57.82 | | Weekly Target 3 | 60.18 | | Weekly Target 4 | 61.36 | | Weekly Target 5 | 63.72 |
Weekly price and volumes for Comcast Corporation
| Date |
Closing |
Open |
Range |
Volume |
Fri 17 October 2025 |
59.00 (-3.04%) |
62.54 |
59.00 - 62.54 |
0.2854 times |
Fri 08 August 2025 |
60.85 (3.14%) |
60.85 |
60.85 - 60.85 |
0.3806 times |
Fri 01 August 2025 |
59.00 (-3.44%) |
59.75 |
59.00 - 59.75 |
0.3806 times |
Tue 27 May 2025 |
61.10 (1.41%) |
61.10 |
61.10 - 61.10 |
0.0951 times |
Tue 22 April 2025 |
60.25 (13.38%) |
57.70 |
57.50 - 60.25 |
0.666 times |
Thu 17 April 2025 |
53.14 (-14.29%) |
61.00 |
53.14 - 64.15 |
2.1882 times |
Wed 16 April 2025 |
62.00 (0%) |
61.00 |
60.50 - 64.15 |
0 times |
Wed 16 April 2025 |
62.00 (0%) |
61.00 |
60.50 - 64.15 |
2.5792 times |
Wed 16 April 2025 |
62.00 (0%) |
61.00 |
60.50 - 64.15 |
0 times |
Wed 16 April 2025 |
62.00 (0.19%) |
63.00 |
58.55 - 64.15 |
3.425 times |
Fri 11 April 2025 |
61.88 (7.24%) |
58.43 |
58.43 - 61.88 |
2.9493 times |

Monthly price and charts ComcastCorporation Strong monthly Stock price targets for ComcastCorporation CCZ are 59 and 59 | Monthly Target 1 | 59 | | Monthly Target 2 | 59 | | Monthly Target 3 | 59 | | Monthly Target 4 | 59 | | Monthly Target 5 | 59 |
Monthly price and volumes Comcast Corporation
| Date |
Closing |
Open |
Range |
Volume |
Fri 17 October 2025 |
59.00 (-5.66%) |
59.00 |
59.00 - 59.00 |
0.0561 times |
Mon 15 September 2025 |
62.54 (2.78%) |
62.54 |
62.54 - 62.54 |
0.0281 times |
Fri 08 August 2025 |
60.85 (1.84%) |
59.00 |
59.00 - 60.85 |
0.1964 times |
Mon 14 July 2025 |
59.75 (-2.21%) |
59.75 |
59.75 - 59.75 |
0.0281 times |
Tue 27 May 2025 |
61.10 (1.41%) |
61.10 |
61.10 - 61.10 |
0.0281 times |
Tue 22 April 2025 |
60.25 (4.6%) |
58.30 |
53.14 - 68.41 |
7.1005 times |
Mon 24 March 2025 |
57.60 (-7.56%) |
57.60 |
57.60 - 57.60 |
0.0281 times |
Thu 20 February 2025 |
62.31 (-2.64%) |
62.31 |
62.31 - 62.31 |
0.0281 times |
Fri 31 January 2025 |
64.00 (4.8%) |
60.16 |
57.75 - 64.00 |
0.2805 times |
Thu 26 December 2024 |
61.07 (3.51%) |
60.24 |
60.24 - 63.00 |
2.2263 times |
Tue 26 November 2024 |
59.00 (-3.1%) |
60.89 |
58.50 - 63.00 |
36.5809 times |

DMA SMA EMA moving averages of Comcast Corporation CCZ
DMA (daily moving average) of Comcast Corporation CCZ
| DMA period | DMA value | | 5 day DMA | 60.23 | | 12 day DMA | 59.93 | | 20 day DMA | 60.21 | | 35 day DMA | 60.39 | | 50 day DMA | 60.37 | | 100 day DMA | 59.77 | | 150 day DMA | 58.31 | | 200 day DMA | 57.98 | EMA (exponential moving average) of Comcast Corporation CCZ
| EMA period | EMA current | EMA prev | EMA prev2 | | 5 day EMA | 60.21 | 60.81 | 59.94 | | 12 day EMA | 60.16 | 60.37 | 59.97 | | 20 day EMA | 60.23 | 60.36 | 60.13 | | 35 day EMA | 60.31 | 60.39 | 60.26 | | 50 day EMA | 60.4 | 60.46 | 60.38 |
SMA (simple moving average) of Comcast Corporation CCZ
| SMA period | SMA current | SMA prev | SMA prev2 | | 5 day SMA | 60.23 | 60.65 | 60.19 | | 12 day SMA | 59.93 | 60.18 | 60.13 | | 20 day SMA | 60.21 | 60.19 | 60.21 | | 35 day SMA | 60.39 | 60.44 | 60.4 | | 50 day SMA | 60.37 | 60.42 | 60.38 | | 100 day SMA | 59.77 | 59.78 | 59.73 | | 150 day SMA | 58.31 | 58.29 | 58.23 | | 200 day SMA | 57.98 | 57.95 | 57.9 |
|
|
