CenturyCommunities CCS full analysis,charts,indicators,moving averages,SMA,DMA,EMA,ADX,MACD,RSICentury Communities CCS WideScreen charts, DMA,SMA,EMA technical analysis, forecast prediction, by indicators ADX,MACD,RSI,CCI NYSE stock exchange
operates under Capital Goods sector & deals in Homebuilding
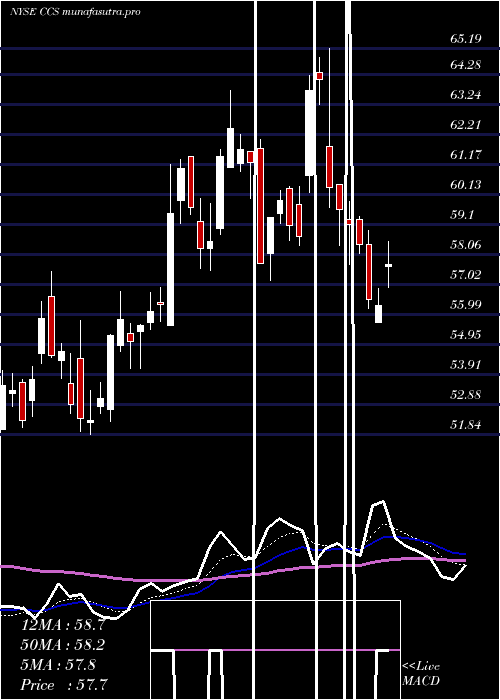
Daily price and charts and targets CenturyCommunities Strong Daily Stock price targets for CenturyCommunities CCS are 61.22 and 63.65 | Daily Target 1 | 60.79 | | Daily Target 2 | 61.65 | | Daily Target 3 | 63.22 | | Daily Target 4 | 64.08 | | Daily Target 5 | 65.65 |
Daily price and volume Century Communities
| Date |
Closing |
Open |
Range |
Volume |
Thu 04 December 2025 |
62.51 (-5.49%) |
63.44 |
62.36 - 64.79 |
1.0754 times |
Wed 03 December 2025 |
66.14 (1.72%) |
65.17 |
65.17 - 67.10 |
0.7802 times |
Tue 02 December 2025 |
65.02 (1.1%) |
64.83 |
63.69 - 65.37 |
0.6342 times |
Mon 01 December 2025 |
64.31 (-1.5%) |
63.99 |
63.99 - 65.86 |
0.8548 times |
Fri 28 November 2025 |
65.29 (0.03%) |
65.22 |
64.51 - 65.65 |
0.4933 times |
Wed 26 November 2025 |
65.27 (1.76%) |
63.19 |
63.13 - 65.96 |
1.3646 times |
Tue 25 November 2025 |
64.14 (6.85%) |
60.87 |
60.70 - 64.41 |
1.2543 times |
Mon 24 November 2025 |
60.03 (-1.62%) |
60.32 |
59.55 - 60.86 |
0.8312 times |
Fri 21 November 2025 |
61.02 (7.66%) |
57.15 |
57.12 - 61.13 |
1.8034 times |
Thu 20 November 2025 |
56.68 (0.6%) |
56.20 |
55.99 - 57.45 |
0.9086 times |
Wed 19 November 2025 |
56.34 (-0.72%) |
57.42 |
56.06 - 57.42 |
0.8269 times |
Weekly price and charts CenturyCommunities Strong weekly Stock price targets for CenturyCommunities CCS are 60.07 and 64.81 | Weekly Target 1 | 59.25 | | Weekly Target 2 | 60.88 | | Weekly Target 3 | 63.99 | | Weekly Target 4 | 65.62 | | Weekly Target 5 | 68.73 |
Weekly price and volumes for Century Communities
| Date |
Closing |
Open |
Range |
Volume |
Thu 04 December 2025 |
62.51 (-4.26%) |
63.99 |
62.36 - 67.10 |
0.6163 times |
Fri 28 November 2025 |
65.29 (7%) |
60.32 |
59.55 - 65.96 |
0.7267 times |
Fri 21 November 2025 |
61.02 (4.13%) |
57.85 |
55.40 - 61.13 |
1.1154 times |
Fri 14 November 2025 |
58.60 (-2.3%) |
60.21 |
58.01 - 60.76 |
0.8936 times |
Fri 07 November 2025 |
59.98 (0.98%) |
58.41 |
57.50 - 61.15 |
1.2411 times |
Fri 31 October 2025 |
59.40 (0%) |
59.98 |
58.77 - 60.23 |
0.2293 times |
Fri 31 October 2025 |
59.40 (-5.94%) |
63.23 |
58.77 - 64.46 |
1.3443 times |
Fri 24 October 2025 |
63.15 (5.06%) |
60.28 |
57.76 - 66.15 |
1.1788 times |
Fri 17 October 2025 |
60.11 (4.12%) |
58.11 |
56.94 - 61.93 |
1.1396 times |
Fri 10 October 2025 |
57.73 (-10.25%) |
64.30 |
56.65 - 64.64 |
1.5151 times |
Fri 03 October 2025 |
64.32 (2.01%) |
63.29 |
62.13 - 65.40 |
0.8283 times |
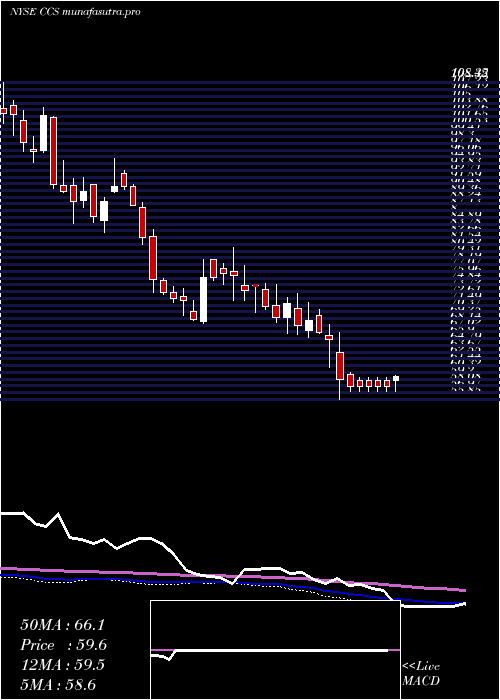
Monthly price and charts CenturyCommunities Strong monthly Stock price targets for CenturyCommunities CCS are 60.07 and 64.81 | Monthly Target 1 | 59.25 | | Monthly Target 2 | 60.88 | | Monthly Target 3 | 63.99 | | Monthly Target 4 | 65.62 | | Monthly Target 5 | 68.73 |
Monthly price and volumes Century Communities
| Date |
Closing |
Open |
Range |
Volume |
Thu 04 December 2025 |
62.51 (-4.26%) |
63.99 |
62.36 - 67.10 |
0.1163 times |
Fri 28 November 2025 |
65.29 (9.92%) |
58.41 |
55.40 - 65.96 |
0.7503 times |
Fri 31 October 2025 |
59.40 (-6.26%) |
63.60 |
56.65 - 66.15 |
1.1096 times |
Tue 30 September 2025 |
63.37 (-3.81%) |
64.49 |
61.80 - 71.23 |
1.0762 times |
Fri 29 August 2025 |
65.88 (17.04%) |
57.65 |
56.93 - 68.42 |
0.8592 times |
Thu 31 July 2025 |
56.29 (-0.05%) |
55.61 |
55.61 - 65.19 |
1.2177 times |
Mon 30 June 2025 |
56.32 (8.58%) |
51.50 |
50.42 - 57.48 |
0.9871 times |
Fri 30 May 2025 |
51.87 (-4.9%) |
54.65 |
51.07 - 58.31 |
1.1825 times |
Wed 30 April 2025 |
54.54 (-18.72%) |
67.50 |
52.41 - 68.25 |
1.2443 times |
Mon 31 March 2025 |
67.10 (-3.36%) |
69.47 |
65.22 - 73.37 |
1.4568 times |
Fri 28 February 2025 |
69.43 (-9.1%) |
74.75 |
68.56 - 78.05 |
1.1886 times |

DMA SMA EMA moving averages of Century Communities CCS
DMA (daily moving average) of Century Communities CCS
| DMA period | DMA value | | 5 day DMA | 64.65 | | 12 day DMA | 61.96 | | 20 day DMA | 60.83 | | 35 day DMA | 60.97 | | 50 day DMA | 61.05 | | 100 day DMA | 62.42 | | 150 day DMA | 60.06 | | 200 day DMA | 61.19 | EMA (exponential moving average) of Century Communities CCS
| EMA period | EMA current | EMA prev | EMA prev2 | | 5 day EMA | 64.01 | 64.76 | 64.07 | | 12 day EMA | 62.8 | 62.85 | 62.25 | | 20 day EMA | 61.99 | 61.94 | 61.5 | | 35 day EMA | 61.59 | 61.54 | 61.27 | | 50 day EMA | 61.7 | 61.67 | 61.49 |
SMA (simple moving average) of Century Communities CCS
| SMA period | SMA current | SMA prev | SMA prev2 | | 5 day SMA | 64.65 | 65.21 | 64.81 | | 12 day SMA | 61.96 | 61.45 | 60.82 | | 20 day SMA | 60.83 | 60.74 | 60.41 | | 35 day SMA | 60.97 | 60.92 | 60.76 | | 50 day SMA | 61.05 | 61.07 | 61.02 | | 100 day SMA | 62.42 | 62.38 | 62.33 | | 150 day SMA | 60.06 | 60.01 | 59.93 | | 200 day SMA | 61.19 | 61.25 | 61.28 |
|
|
