ClearChannel CCO full analysis,charts,indicators,moving averages,SMA,DMA,EMA,ADX,MACD,RSIClear Channel CCO WideScreen charts, DMA,SMA,EMA technical analysis, forecast prediction, by indicators ADX,MACD,RSI,CCI NYSE stock exchange
operates under Consumer Services sector & deals in Advertising
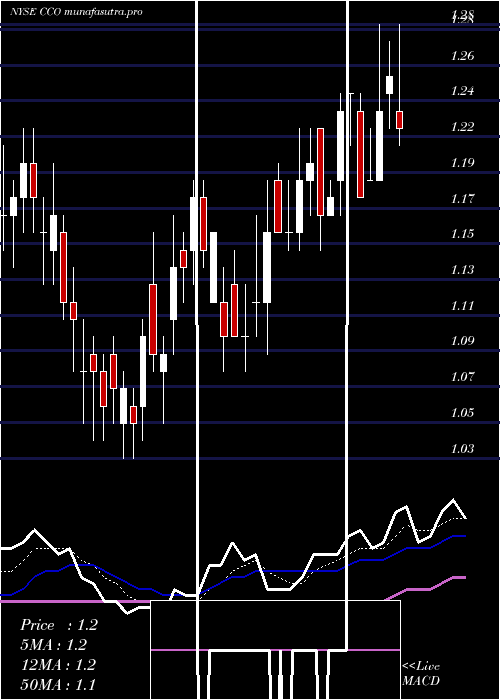
Daily price and charts and targets ClearChannel Strong Daily Stock price targets for ClearChannel CCO are 1.76 and 2.08 | Daily Target 1 | 1.5 | | Daily Target 2 | 1.7 | | Daily Target 3 | 1.8233333333333 | | Daily Target 4 | 2.02 | | Daily Target 5 | 2.14 |
Daily price and volume Clear Channel
| Date |
Closing |
Open |
Range |
Volume |
Mon 20 October 2025 |
1.89 (12.5%) |
1.69 |
1.63 - 1.95 |
2.945 times |
Fri 17 October 2025 |
1.68 (18.31%) |
1.40 |
1.39 - 1.92 |
3.967 times |
Thu 16 October 2025 |
1.42 (4.41%) |
1.38 |
1.37 - 1.43 |
0.4788 times |
Wed 15 October 2025 |
1.36 (0.74%) |
1.36 |
1.36 - 1.42 |
0.3158 times |
Tue 14 October 2025 |
1.35 (3.85%) |
1.27 |
1.27 - 1.36 |
0.3706 times |
Mon 13 October 2025 |
1.30 (0%) |
1.32 |
1.29 - 1.35 |
0.2868 times |
Fri 10 October 2025 |
1.30 (-4.41%) |
1.36 |
1.29 - 1.39 |
0.4467 times |
Thu 09 October 2025 |
1.36 (-4.9%) |
1.44 |
1.34 - 1.45 |
0.5915 times |
Wed 08 October 2025 |
1.43 (0%) |
1.43 |
1.43 - 1.48 |
0.2391 times |
Tue 07 October 2025 |
1.43 (-3.38%) |
1.48 |
1.41 - 1.50 |
0.3587 times |
Mon 06 October 2025 |
1.48 (0%) |
1.49 |
1.47 - 1.51 |
0.1712 times |
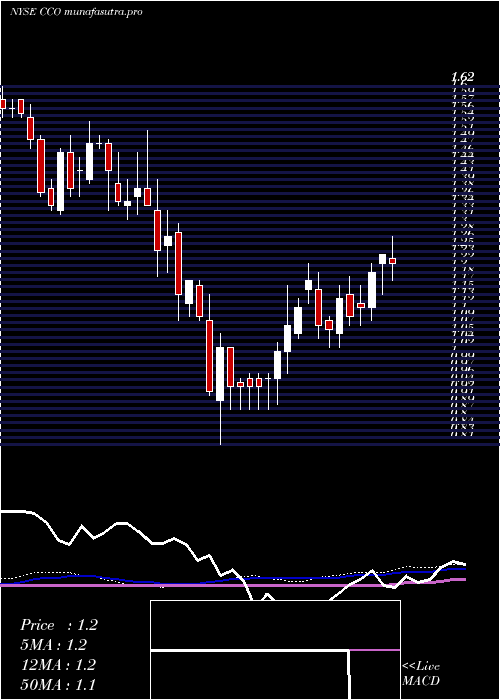
Weekly price and charts ClearChannel Strong weekly Stock price targets for ClearChannel CCO are 1.76 and 2.08 | Weekly Target 1 | 1.5 | | Weekly Target 2 | 1.7 | | Weekly Target 3 | 1.8233333333333 | | Weekly Target 4 | 2.02 | | Weekly Target 5 | 2.14 |
Weekly price and volumes for Clear Channel
| Date |
Closing |
Open |
Range |
Volume |
Mon 20 October 2025 |
1.89 (12.5%) |
1.69 |
1.63 - 1.95 |
0.9432 times |
Fri 17 October 2025 |
1.68 (29.23%) |
1.32 |
1.27 - 1.92 |
1.7356 times |
Fri 10 October 2025 |
1.30 (-12.16%) |
1.49 |
1.29 - 1.51 |
0.5788 times |
Fri 03 October 2025 |
1.48 (0%) |
1.51 |
1.48 - 1.59 |
0.78 times |
Fri 26 September 2025 |
1.48 (5.71%) |
1.43 |
1.42 - 1.61 |
1.1539 times |
Fri 19 September 2025 |
1.40 (6.87%) |
1.33 |
1.28 - 1.51 |
2.0203 times |
Fri 12 September 2025 |
1.31 (-0.76%) |
1.35 |
1.24 - 1.43 |
1.5945 times |
Fri 05 September 2025 |
1.32 (6.45%) |
1.23 |
1.23 - 1.35 |
0.4692 times |
Fri 29 August 2025 |
1.24 (0%) |
1.24 |
1.22 - 1.26 |
0.1114 times |
Fri 29 August 2025 |
1.24 (-3.13%) |
1.26 |
1.22 - 1.32 |
0.6132 times |
Fri 22 August 2025 |
1.28 (8.47%) |
1.17 |
1.15 - 1.28 |
0.8549 times |
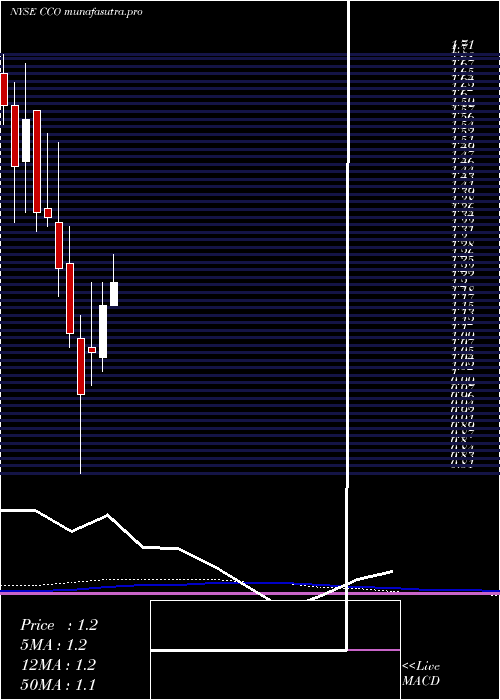
Monthly price and charts ClearChannel Strong monthly Stock price targets for ClearChannel CCO are 1.58 and 2.26 | Monthly Target 1 | 1.02 | | Monthly Target 2 | 1.46 | | Monthly Target 3 | 1.7033333333333 | | Monthly Target 4 | 2.14 | | Monthly Target 5 | 2.38 |
Monthly price and volumes Clear Channel
| Date |
Closing |
Open |
Range |
Volume |
Mon 20 October 2025 |
1.89 (19.62%) |
1.58 |
1.27 - 1.95 |
1.0866 times |
Tue 30 September 2025 |
1.58 (27.42%) |
1.23 |
1.23 - 1.61 |
1.6712 times |
Fri 29 August 2025 |
1.24 (16.98%) |
1.10 |
1.00 - 1.32 |
1.2761 times |
Thu 31 July 2025 |
1.06 (-9.4%) |
1.17 |
1.04 - 1.28 |
0.7927 times |
Mon 30 June 2025 |
1.17 (9.35%) |
1.06 |
1.03 - 1.22 |
1.9112 times |
Fri 30 May 2025 |
1.07 (9.18%) |
1.08 |
1.00 - 1.22 |
0.7043 times |
Wed 30 April 2025 |
0.98 (-11.71%) |
1.10 |
0.81 - 1.15 |
0.9919 times |
Mon 31 March 2025 |
1.11 (-11.2%) |
1.26 |
1.08 - 1.34 |
0.685 times |
Fri 28 February 2025 |
1.25 (-8.09%) |
1.35 |
1.19 - 1.52 |
0.4423 times |
Fri 31 January 2025 |
1.36 (-0.73%) |
1.38 |
1.34 - 1.54 |
0.4388 times |
Tue 31 December 2024 |
1.37 (-12.74%) |
1.59 |
1.33 - 1.59 |
0.4753 times |
DMA SMA EMA moving averages of Clear Channel CCO
DMA (daily moving average) of Clear Channel CCO
| DMA period | DMA value | | 5 day DMA | 1.54 | | 12 day DMA | 1.46 | | 20 day DMA | 1.49 | | 35 day DMA | 1.42 | | 50 day DMA | 1.36 | | 100 day DMA | 1.25 | | 150 day DMA | 1.19 | | 200 day DMA | 1.23 | EMA (exponential moving average) of Clear Channel CCO
| EMA period | EMA current | EMA prev | EMA prev2 | | 5 day EMA | 1.62 | 1.48 | 1.38 | | 12 day EMA | 1.5 | 1.43 | 1.39 | | 20 day EMA | 1.48 | 1.44 | 1.41 | | 35 day EMA | 1.42 | 1.39 | 1.37 | | 50 day EMA | 1.35 | 1.33 | 1.32 |
SMA (simple moving average) of Clear Channel CCO
| SMA period | SMA current | SMA prev | SMA prev2 | | 5 day SMA | 1.54 | 1.42 | 1.35 | | 12 day SMA | 1.46 | 1.43 | 1.42 | | 20 day SMA | 1.49 | 1.47 | 1.45 | | 35 day SMA | 1.42 | 1.41 | 1.39 | | 50 day SMA | 1.36 | 1.34 | 1.33 | | 100 day SMA | 1.25 | 1.24 | 1.24 | | 150 day SMA | 1.19 | 1.18 | 1.18 | | 200 day SMA | 1.23 | 1.23 | 1.23 |
|
|
