CarnivalCorporation CCL full analysis,charts,indicators,moving averages,SMA,DMA,EMA,ADX,MACD,RSICarnival Corporation CCL WideScreen charts, DMA,SMA,EMA technical analysis, forecast prediction, by indicators ADX,MACD,RSI,CCI NYSE stock exchange
operates under Consumer Services sector & deals in Marine Transportation
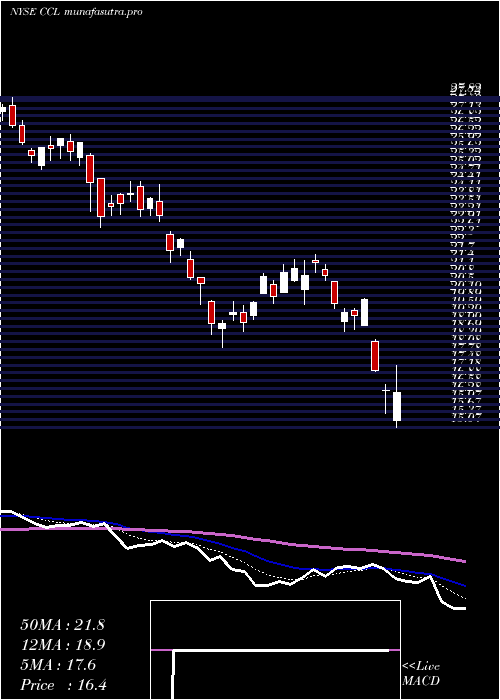
Daily price and charts and targets CarnivalCorporation Strong Daily Stock price targets for CarnivalCorporation CCL are 25.41 and 26 | Daily Target 1 | 25.28 | | Daily Target 2 | 25.54 | | Daily Target 3 | 25.866666666667 | | Daily Target 4 | 26.13 | | Daily Target 5 | 26.46 |
Daily price and volume Carnival Corporation
| Date |
Closing |
Open |
Range |
Volume |
Thu 04 December 2025 |
25.81 (-0.88%) |
26.12 |
25.60 - 26.19 |
0.6013 times |
Wed 03 December 2025 |
26.04 (0.7%) |
25.83 |
25.53 - 26.15 |
1.0678 times |
Tue 02 December 2025 |
25.86 (-0.27%) |
25.98 |
25.41 - 26.20 |
0.6284 times |
Mon 01 December 2025 |
25.93 (0.58%) |
25.64 |
25.41 - 25.98 |
0.923 times |
Fri 28 November 2025 |
25.78 (1.38%) |
25.67 |
25.51 - 26.01 |
0.653 times |
Wed 26 November 2025 |
25.43 (-1.13%) |
25.87 |
25.43 - 26.11 |
1.0119 times |
Tue 25 November 2025 |
25.72 (3.92%) |
25.00 |
24.60 - 26.36 |
1.3299 times |
Mon 24 November 2025 |
24.75 (-6.81%) |
26.99 |
24.60 - 26.99 |
1.6565 times |
Fri 21 November 2025 |
26.56 (4.9%) |
25.79 |
25.58 - 26.82 |
0.9597 times |
Thu 20 November 2025 |
25.32 (-2.91%) |
26.36 |
25.29 - 26.63 |
1.1685 times |
Wed 19 November 2025 |
26.08 (1.32%) |
26.10 |
25.85 - 26.39 |
0.6779 times |
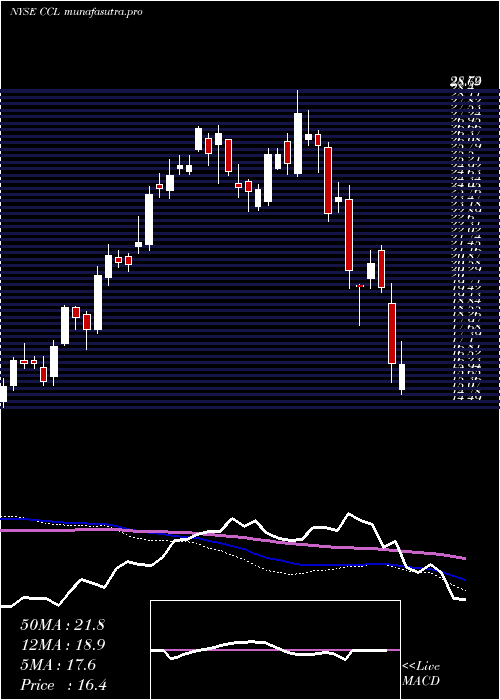
Weekly price and charts CarnivalCorporation Strong weekly Stock price targets for CarnivalCorporation CCL are 25.61 and 26.4 | Weekly Target 1 | 25.02 | | Weekly Target 2 | 25.41 | | Weekly Target 3 | 25.806666666667 | | Weekly Target 4 | 26.2 | | Weekly Target 5 | 26.6 |
Weekly price and volumes for Carnival Corporation
| Date |
Closing |
Open |
Range |
Volume |
Thu 04 December 2025 |
25.81 (0.12%) |
25.64 |
25.41 - 26.20 |
0.731 times |
Fri 28 November 2025 |
25.78 (-2.94%) |
26.99 |
24.60 - 26.99 |
1.0558 times |
Fri 21 November 2025 |
26.56 (2.08%) |
25.94 |
25.10 - 26.82 |
0.9695 times |
Fri 14 November 2025 |
26.02 (-2.62%) |
27.09 |
25.29 - 27.82 |
0.9285 times |
Fri 07 November 2025 |
26.72 (-7.32%) |
28.24 |
25.91 - 28.55 |
0.9636 times |
Fri 31 October 2025 |
28.83 (0%) |
28.25 |
28.02 - 28.98 |
0.542 times |
Fri 31 October 2025 |
28.83 (-1.84%) |
29.70 |
27.55 - 29.89 |
1.8901 times |
Fri 24 October 2025 |
29.37 (3.56%) |
28.40 |
28.36 - 30.37 |
0.9503 times |
Fri 17 October 2025 |
28.36 (2.42%) |
28.21 |
27.47 - 29.40 |
0.9154 times |
Fri 10 October 2025 |
27.69 (-3.05%) |
28.53 |
27.61 - 29.26 |
1.0536 times |
Fri 03 October 2025 |
28.56 (-6.73%) |
32.21 |
28.32 - 32.50 |
2.5252 times |
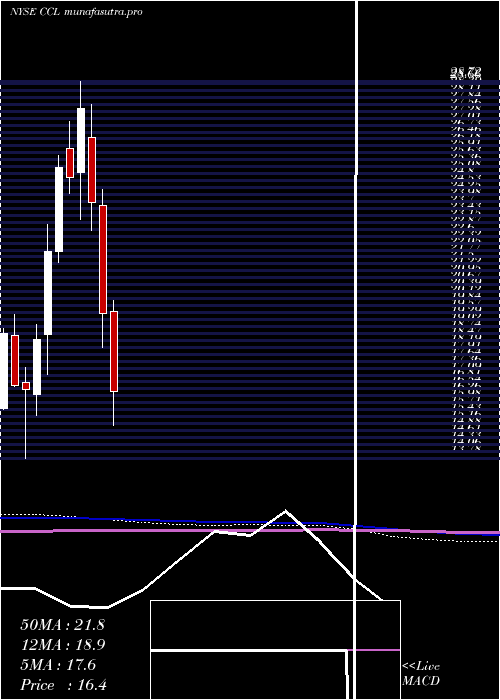
Monthly price and charts CarnivalCorporation Strong monthly Stock price targets for CarnivalCorporation CCL are 25.61 and 26.4 | Monthly Target 1 | 25.02 | | Monthly Target 2 | 25.41 | | Monthly Target 3 | 25.806666666667 | | Monthly Target 4 | 26.2 | | Monthly Target 5 | 26.6 |
Monthly price and volumes Carnival Corporation
| Date |
Closing |
Open |
Range |
Volume |
Thu 04 December 2025 |
25.81 (0.12%) |
25.64 |
25.41 - 26.20 |
0.1385 times |
Fri 28 November 2025 |
25.78 (-10.58%) |
28.24 |
24.60 - 28.55 |
0.7425 times |
Fri 31 October 2025 |
28.83 (-0.28%) |
28.88 |
27.47 - 30.37 |
1.1691 times |
Tue 30 September 2025 |
28.91 (-9.34%) |
30.70 |
28.59 - 32.80 |
1.1293 times |
Fri 29 August 2025 |
31.89 (7.12%) |
29.04 |
28.07 - 32.77 |
0.7817 times |
Thu 31 July 2025 |
29.77 (5.87%) |
28.08 |
28.07 - 31.01 |
1.1 times |
Mon 30 June 2025 |
28.12 (21.1%) |
23.07 |
22.11 - 28.18 |
1.2227 times |
Fri 30 May 2025 |
23.22 (26.61%) |
18.68 |
18.51 - 23.67 |
1.0754 times |
Wed 30 April 2025 |
18.34 (-6.09%) |
19.60 |
15.07 - 20.05 |
1.3217 times |
Mon 31 March 2025 |
19.53 (-18.39%) |
23.82 |
18.16 - 24.47 |
1.319 times |
Fri 28 February 2025 |
23.93 (-13.52%) |
26.52 |
22.82 - 27.82 |
0.8182 times |
DMA SMA EMA moving averages of Carnival Corporation CCL
DMA (daily moving average) of Carnival Corporation CCL
| DMA period | DMA value | | 5 day DMA | 25.88 | | 12 day DMA | 25.75 | | 20 day DMA | 26.02 | | 35 day DMA | 27.11 | | 50 day DMA | 27.66 | | 100 day DMA | 29.07 | | 150 day DMA | 27.48 | | 200 day DMA | 25.6 | EMA (exponential moving average) of Carnival Corporation CCL
| EMA period | EMA current | EMA prev | EMA prev2 | | 5 day EMA | 25.85 | 25.87 | 25.78 | | 12 day EMA | 25.93 | 25.95 | 25.93 | | 20 day EMA | 26.24 | 26.28 | 26.31 | | 35 day EMA | 26.91 | 26.98 | 27.04 | | 50 day EMA | 27.74 | 27.82 | 27.89 |
SMA (simple moving average) of Carnival Corporation CCL
| SMA period | SMA current | SMA prev | SMA prev2 | | 5 day SMA | 25.88 | 25.81 | 25.74 | | 12 day SMA | 25.75 | 25.71 | 25.71 | | 20 day SMA | 26.02 | 26.08 | 26.08 | | 35 day SMA | 27.11 | 27.2 | 27.28 | | 50 day SMA | 27.66 | 27.75 | 27.84 | | 100 day SMA | 29.07 | 29.1 | 29.13 | | 150 day SMA | 27.48 | 27.43 | 27.38 | | 200 day SMA | 25.6 | 25.6 | 25.6 |
|
|
